"A framework to organize, communicate, and understand the science of our world." – Esri
Global real estate is an asset class more valuable than all stocks, shares, and securitized debt combined, at $228+ trillion. There are remarkable technologies pushing the boundaries of the industry's evolutionary curve—Internet of Things, Augmented Reality, Artificial Intelligence, 3D printing, drones—yet in terms of Geographic Information Systems (GIS), it is seemingly difficult to find consumer technology for those that could benefit from it the most. Guarded behind expensive paywalls reserved for esoteric means.
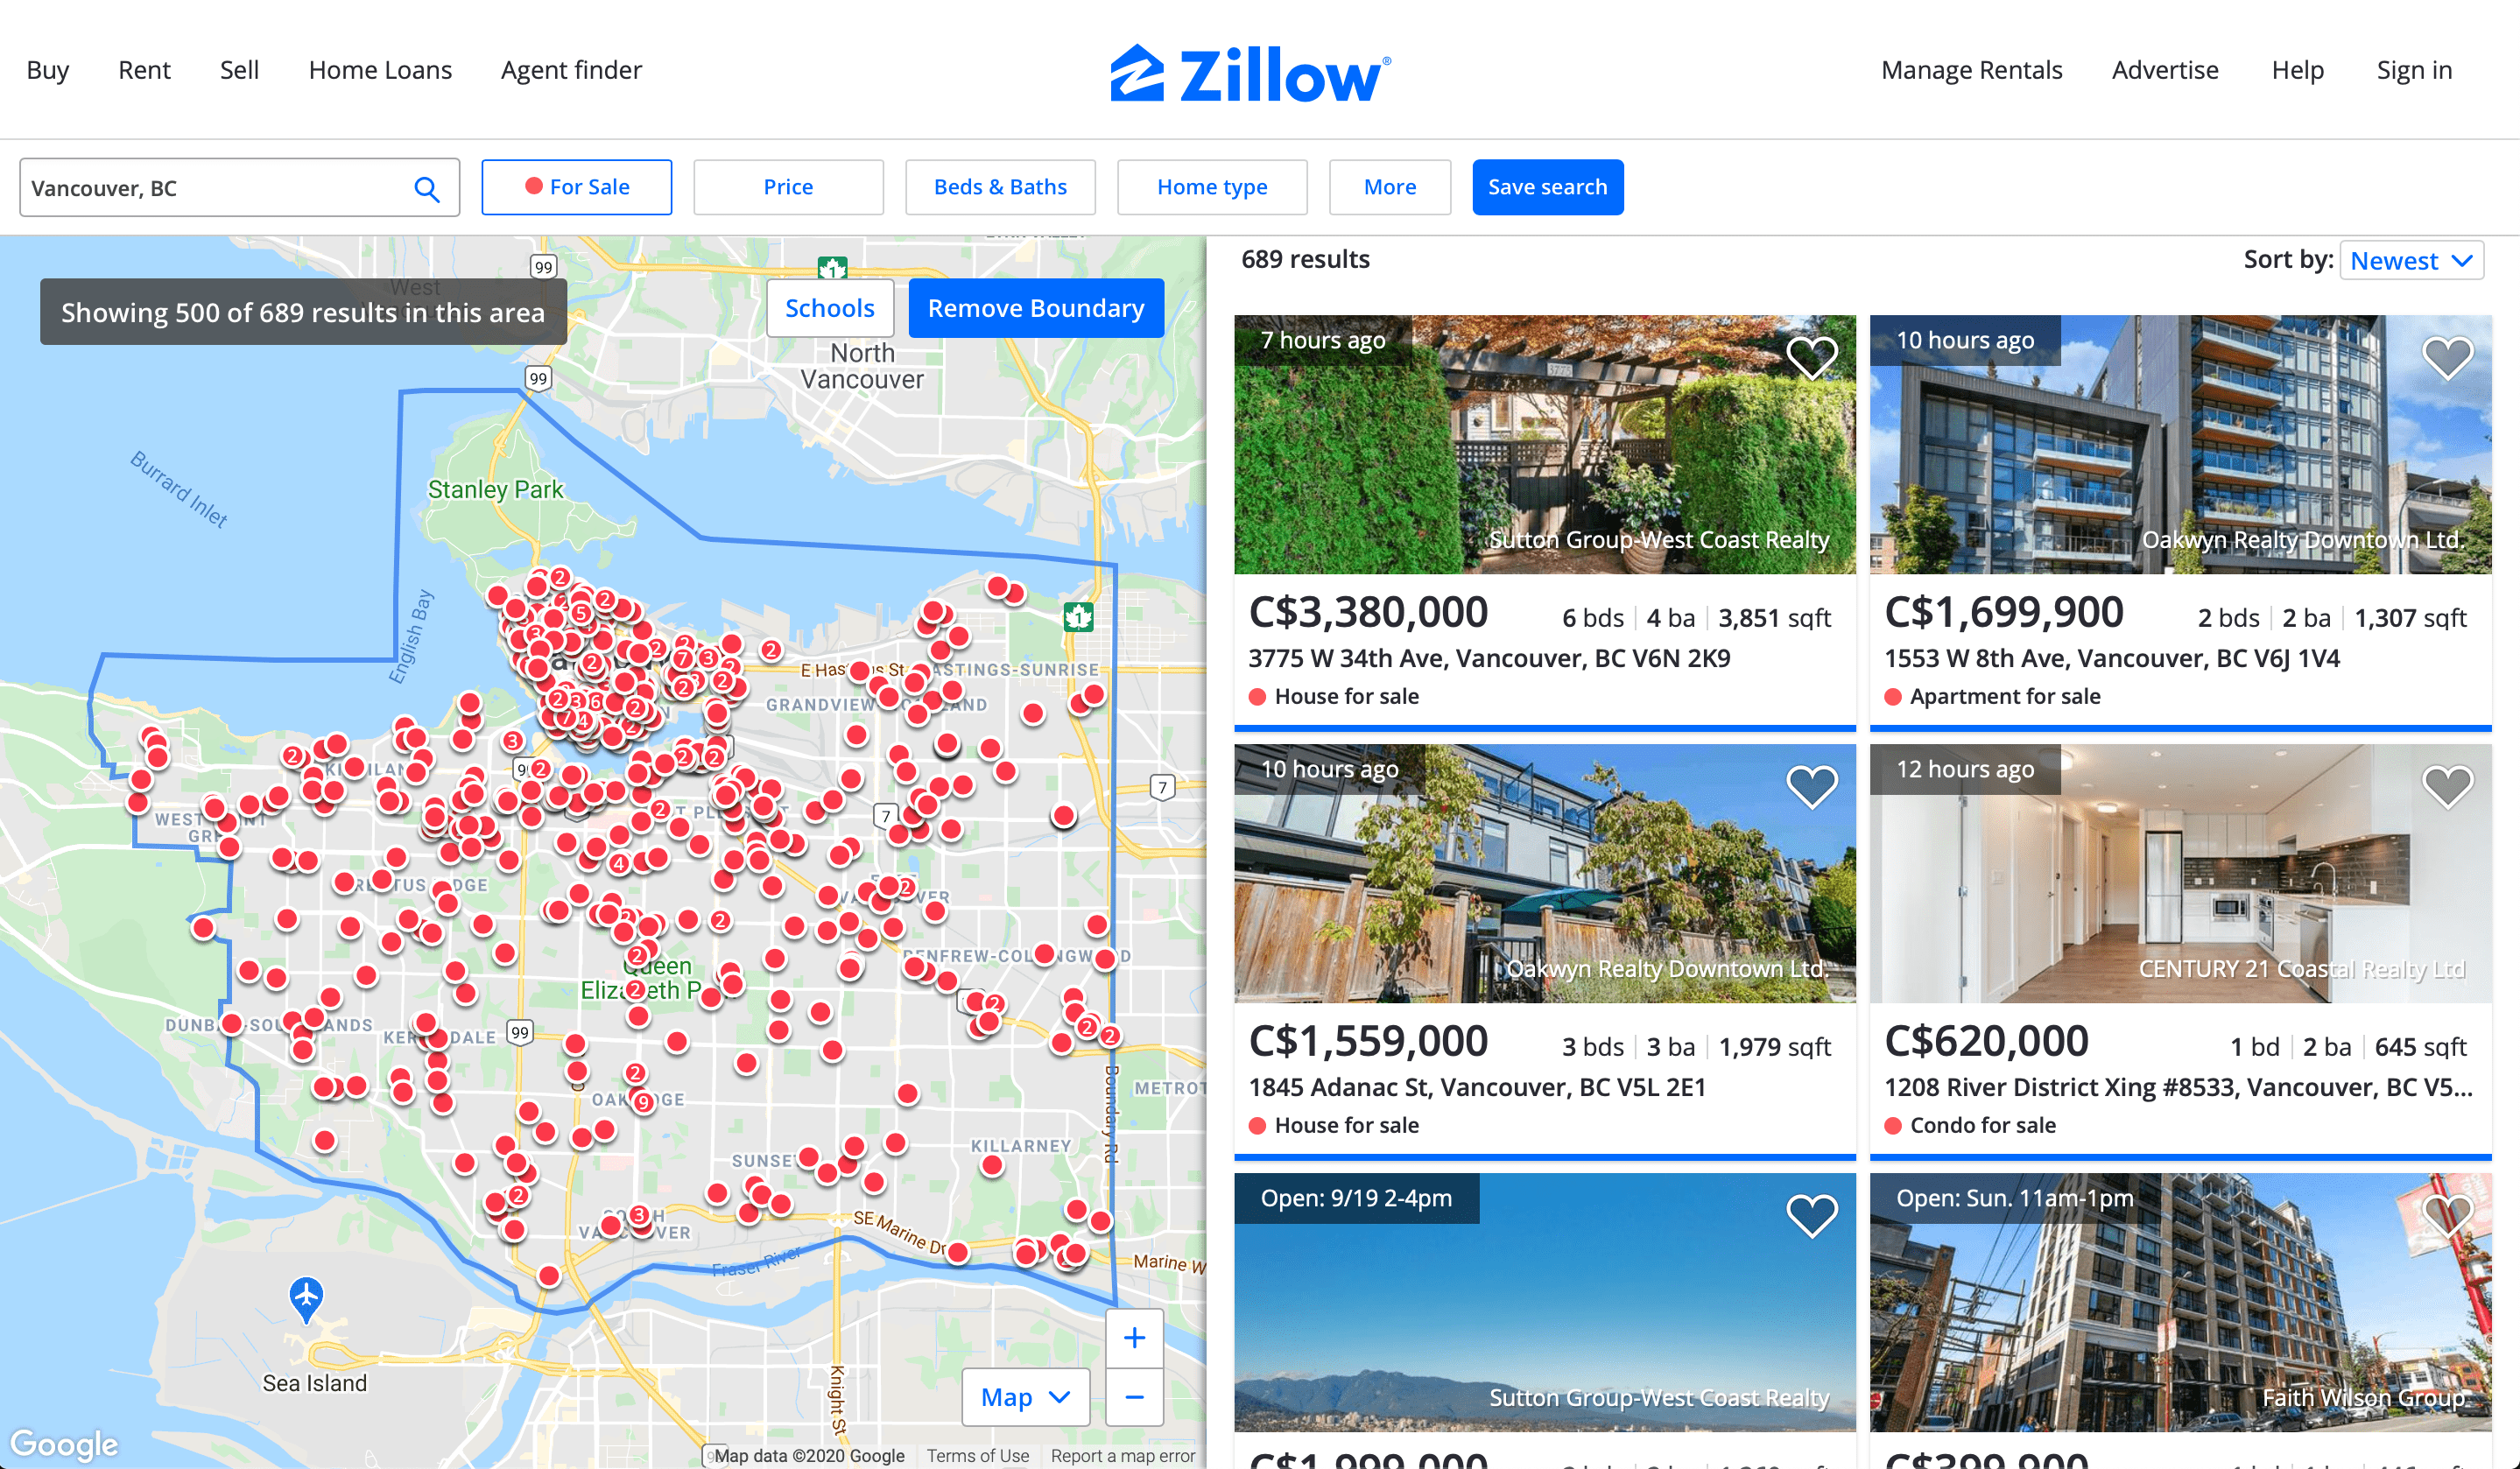
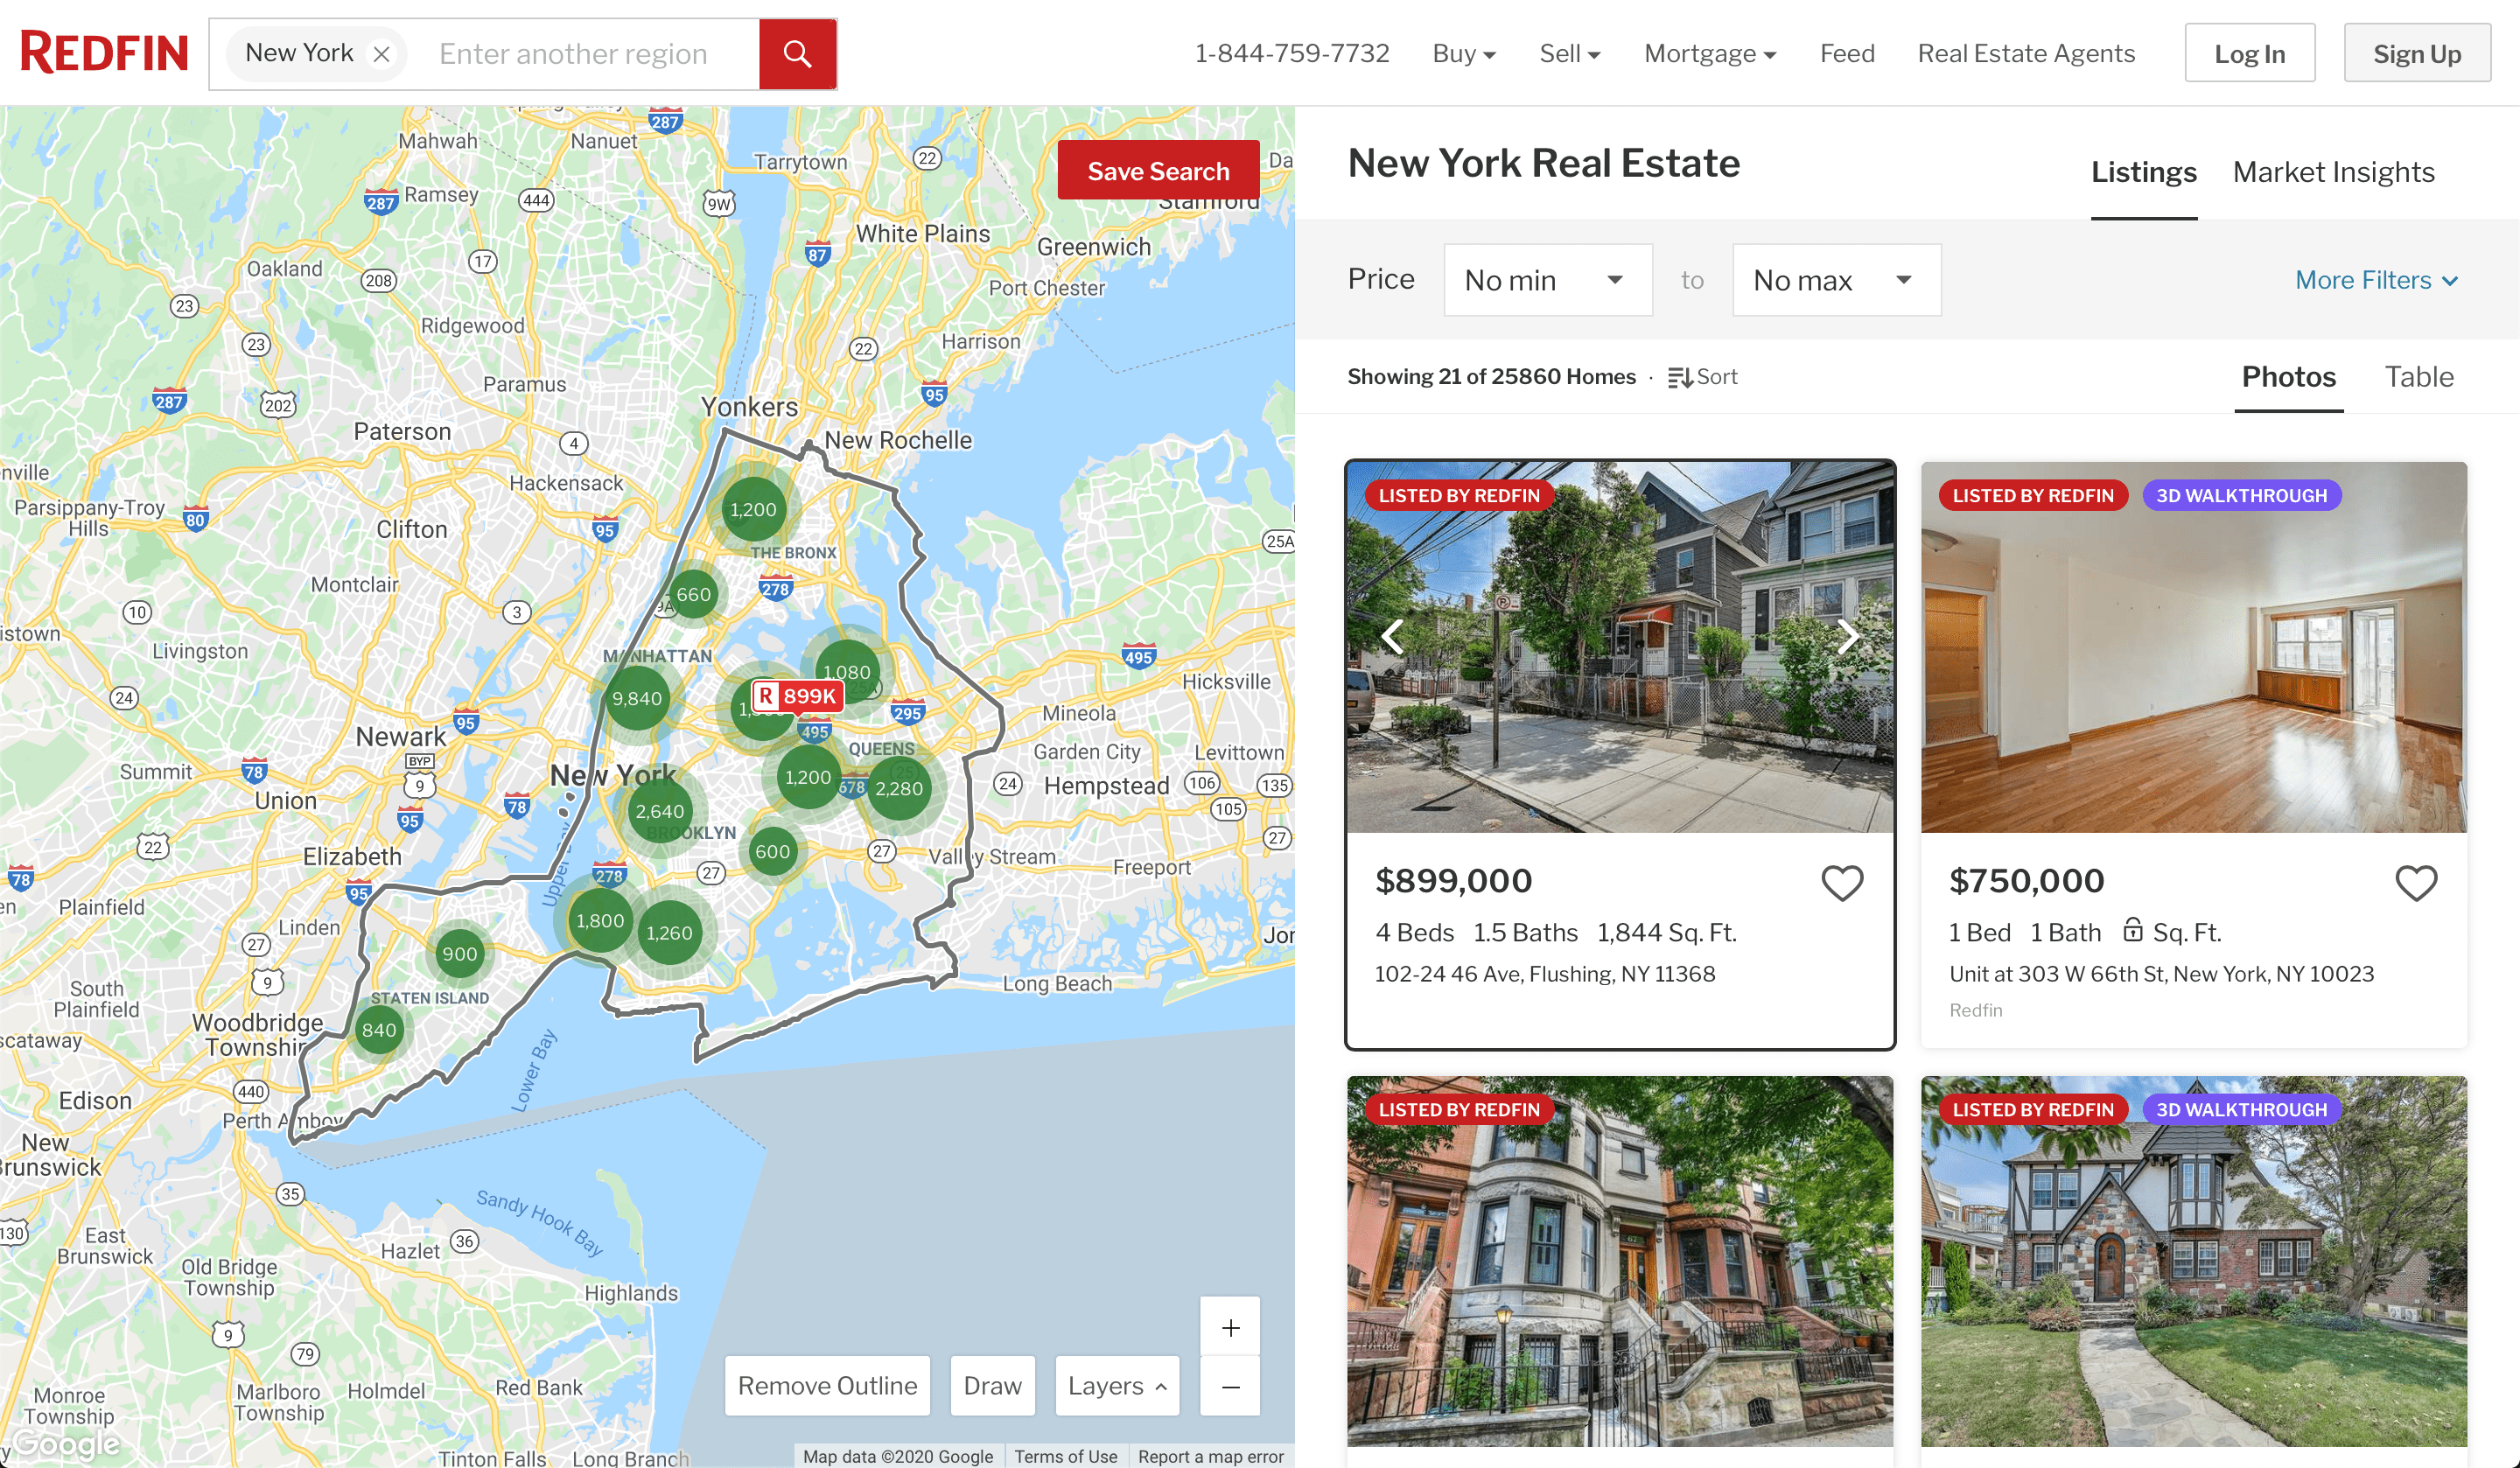
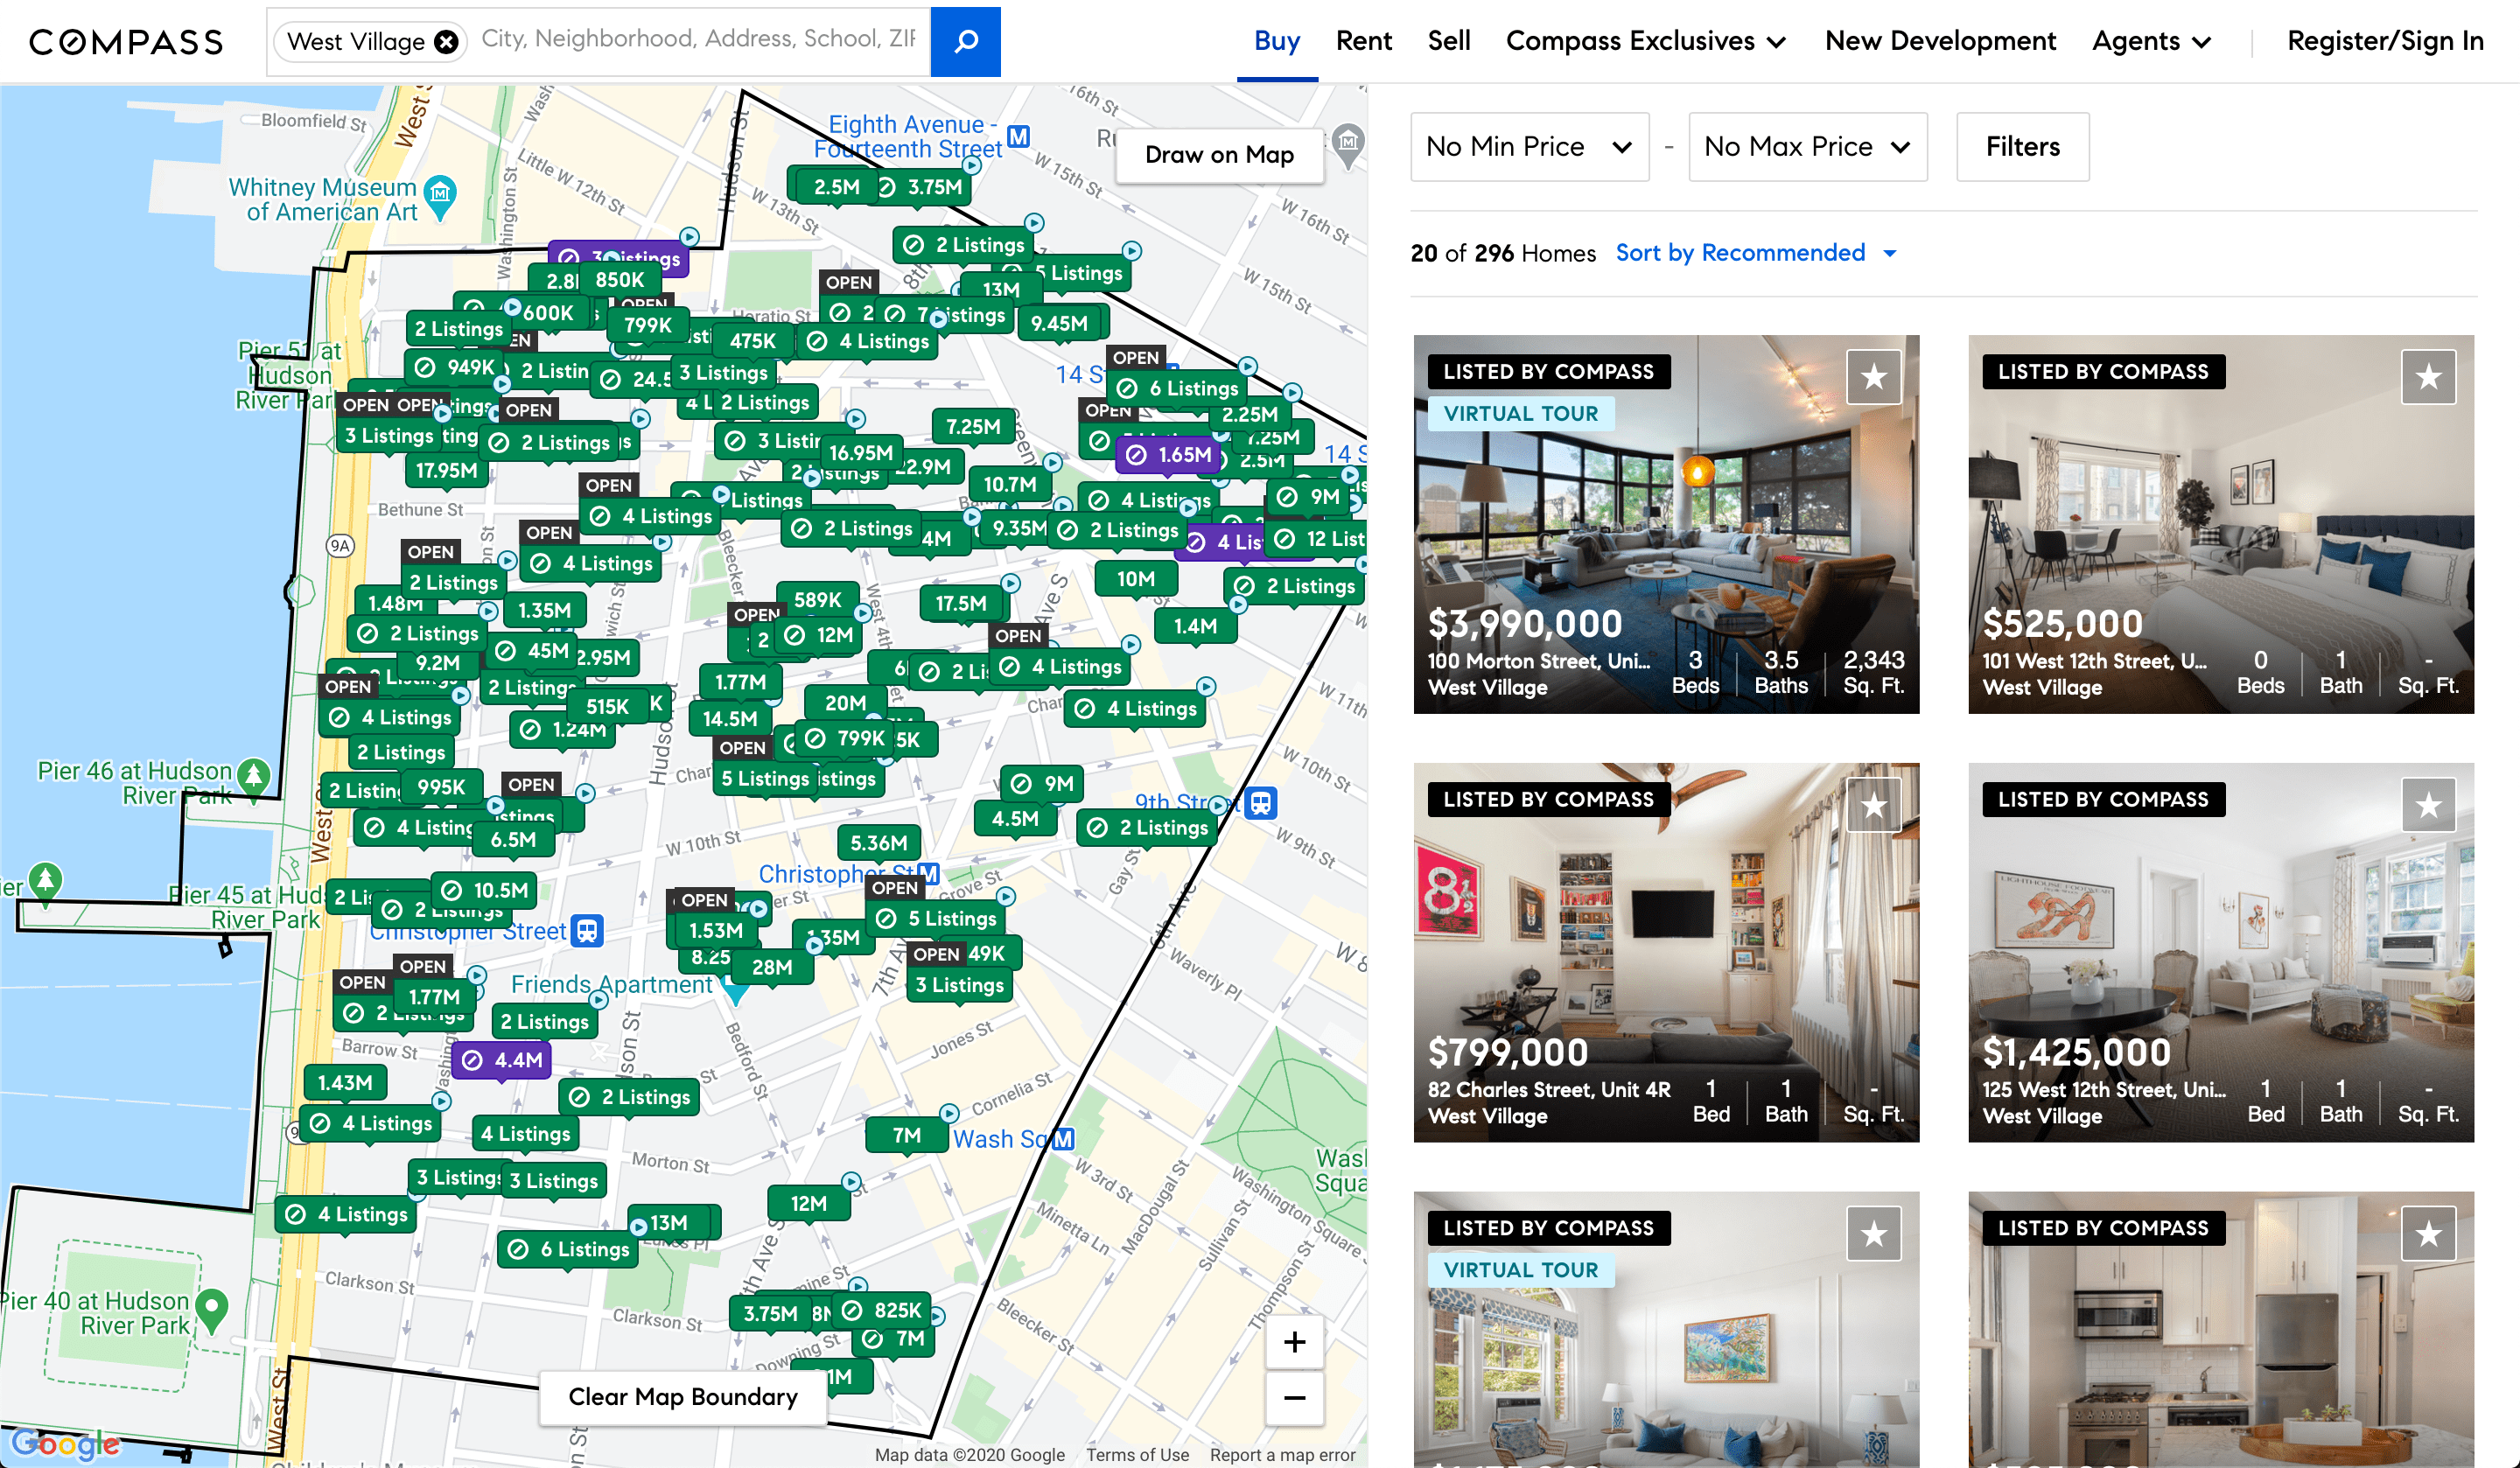
Zillow et al. have dominated the wide end of the funnel searching for real estate, and it's hard to argue the value these portals bring to their audience in terms of exposure, inventory, and liquidity. They make capital-intensive data available to the public for free, yet beyond the rudimentary displaying of information, data can be even more effective when telling stories, revealing obscure trends, and fostering greater transparency.
Anecdotally, the first duplex investment property I took part in many years ago happened to have a registered easement on title, costing us tens of thousands in court upon subdivision—courtesy of a pesky neighbour and negligence on the realtor's part. Despite a lengthy litigation battle, I wouldn't trade those scars for anything, yet the lessons imparted led me in pursuit of developing solutions for years to come.
Even today, an unassuming consumer like my dad still faces uncertainty when I tell him the cheap place he took interest in carries that value because it's located on leasehold land. A home buyer wouldn't necessarily seek out enterprise software to perform a thorough analysis of their potential purchase.
It would be naive to assume such issues could be remedied overnight with better data and mapping technology, but lacking proper education in real property, reliance can neither be fully placed on a real estate professional trying to make ends meet. There will always be a need for ethical professional representation—akin to the trust we put into a family doctor—but it is prudent for both parties to be sufficiently armed with knowledge prior to making any significant decisions.
I often refer to the game SimCity (as I alluded to before), which was part of the UBC course curriculum that sparked an obsession with visualizing real estate data. It's interesting how a videogame can be more comprehensive than what you'll find online—particularly when searching for one of the largest investment decisions you're likely to make in your lifetime.
SimCity Cities of Tomorrow
Advancements in computer engineering, such as high-performance networks and cloud services, provide the conduit through which better tools and opportunities in Proptech can emerge. This article is meant to be an exploration into how GIS is being applied to the real estate industry on both a consumer and data science front, as well as a glimpse into companies making headway toward SimCity-like analysis a reality.
Mapping the real-world
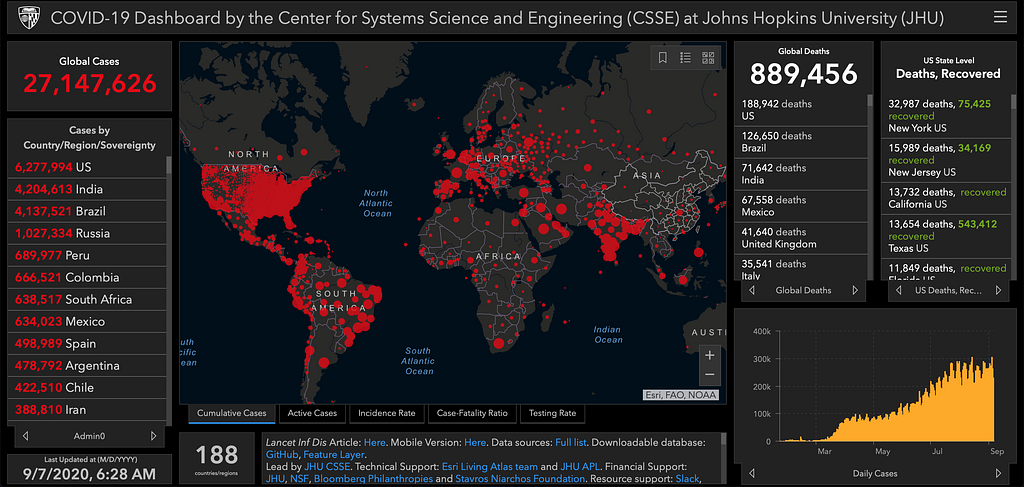
In framing the importance of GIS, we don't need to look very far into the past, as COVID-19 has been the center of attention. Johns Hopkins University has done an outstanding job in visualizing how the virus is affecting the world around us. The mapping technology is provided by the global leader in location intelligence—a company known as the Environmental Systems Research Institute (Esri).
Johns Hopkins University
Since 1969, they have been helping to solve some of the world's most difficult problems—revealing patterns, trends, and relationships about anything meaningful. They describe GIS as a framework for gathering, managing, and analyzing data. Organizing layers of information into useful visualizations so users can make smarter decisions.
Esri developed and regulates a geospatial vector format called the shapefile, which stores information like points, lines, polygons, and properties describing these features. In order to store and work with GIS data, the predominant tool is PostGIS—a spatial database extender for PostgreSQL allowing location queries to be run in SQL:
SELECT *
FROM cities, parcels
WHERE ST_Contains(cities.geom, parcels.geom)
AND cities.name = 'Vancouver';
Location features will typically be cast into a geometry or geography column in a spatial table, or into a standardized GeoJSON format in a jsonb column. GeoJSON has encoded data about geographic features which can then be communicated using Javascript—a ubiquitous programming language fundamentally about objects. It plays an important role in today's open data platforms and web APIs like Mapbox, in providing building blocks to integrate location into mobile and web applications.
Open-source geospatial tools
There is a vast array of languages and libraries to cut and skin geographic data, but the particular focus will be on Python and Ruby. These are some of the open-source libraries most frequently used when working with GIS data:
Python
Fiona: reads and writes data in standard Python IO style.
Shapely: set-theoretic analysis and manipulation of planar features.
GeoPandas: extends the datatypes used by pandas to allow spatial operations on geometric types.
ArcGIS: a powerful Python library for spatial analysis, mapping, and GIS.
Ruby
RGeo: a key component for writing location-aware applications in Ruby on Rails.
RGeo-GeoJSON: an extension to RGeo that provides GeoJSON encoding and decoding.
Python libraries are arguably more capable. Those written in Ruby are no less effective for certain purposes, yet unfortunately not as well maintained. Depending on the complexity of the application you're trying to build, you'll likely be using a combination of tools written in various languages. There are also command line programs like ogr2ogr that can convert simple features between file formats. Most of the time, however, the data will end up in a simple collection of feature objects:
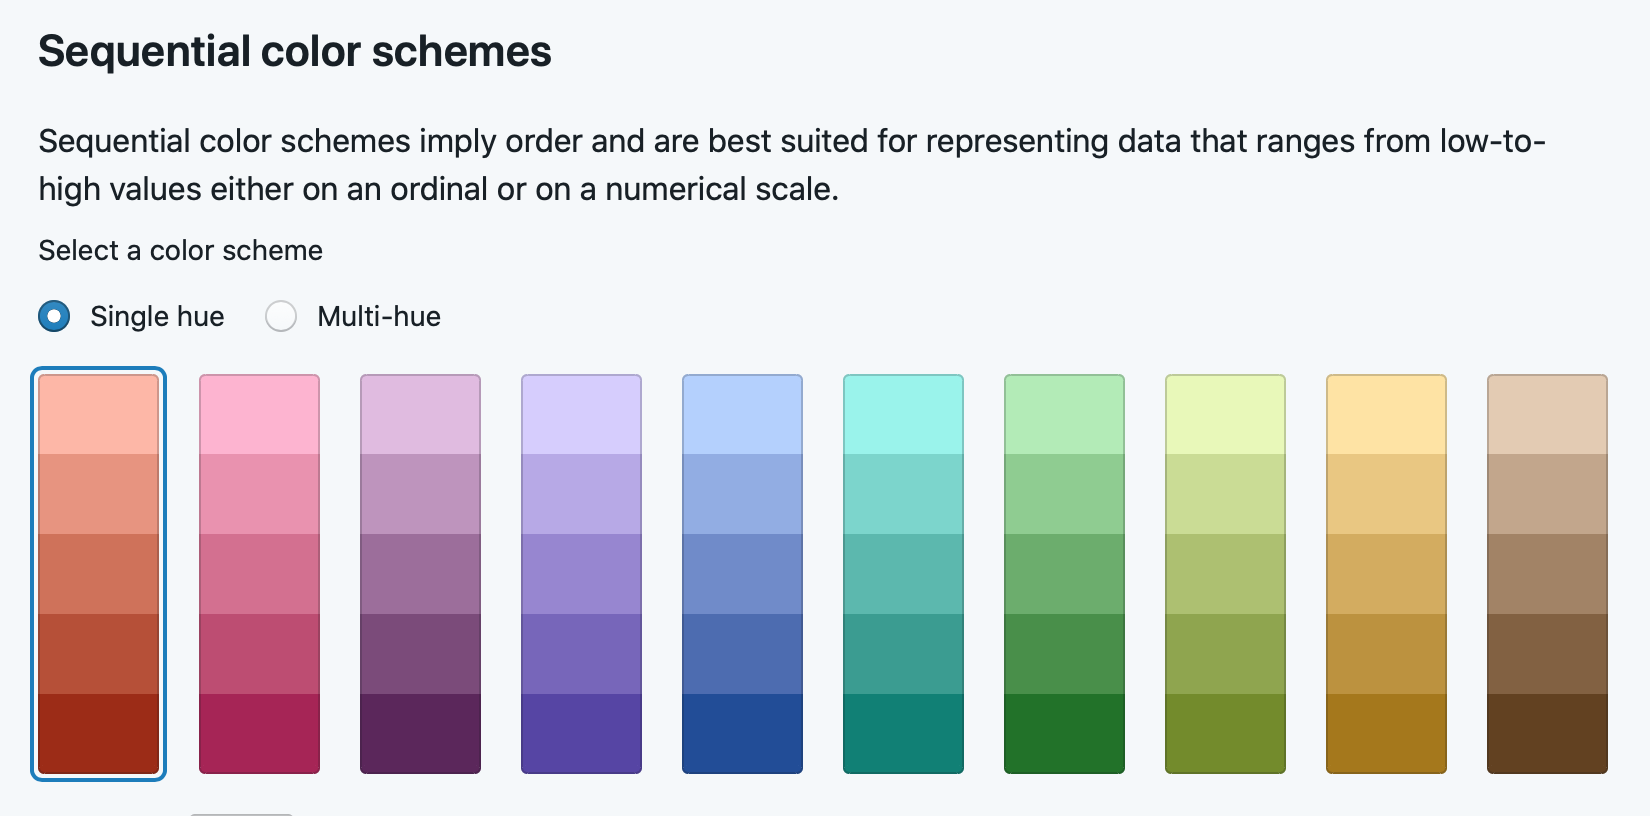
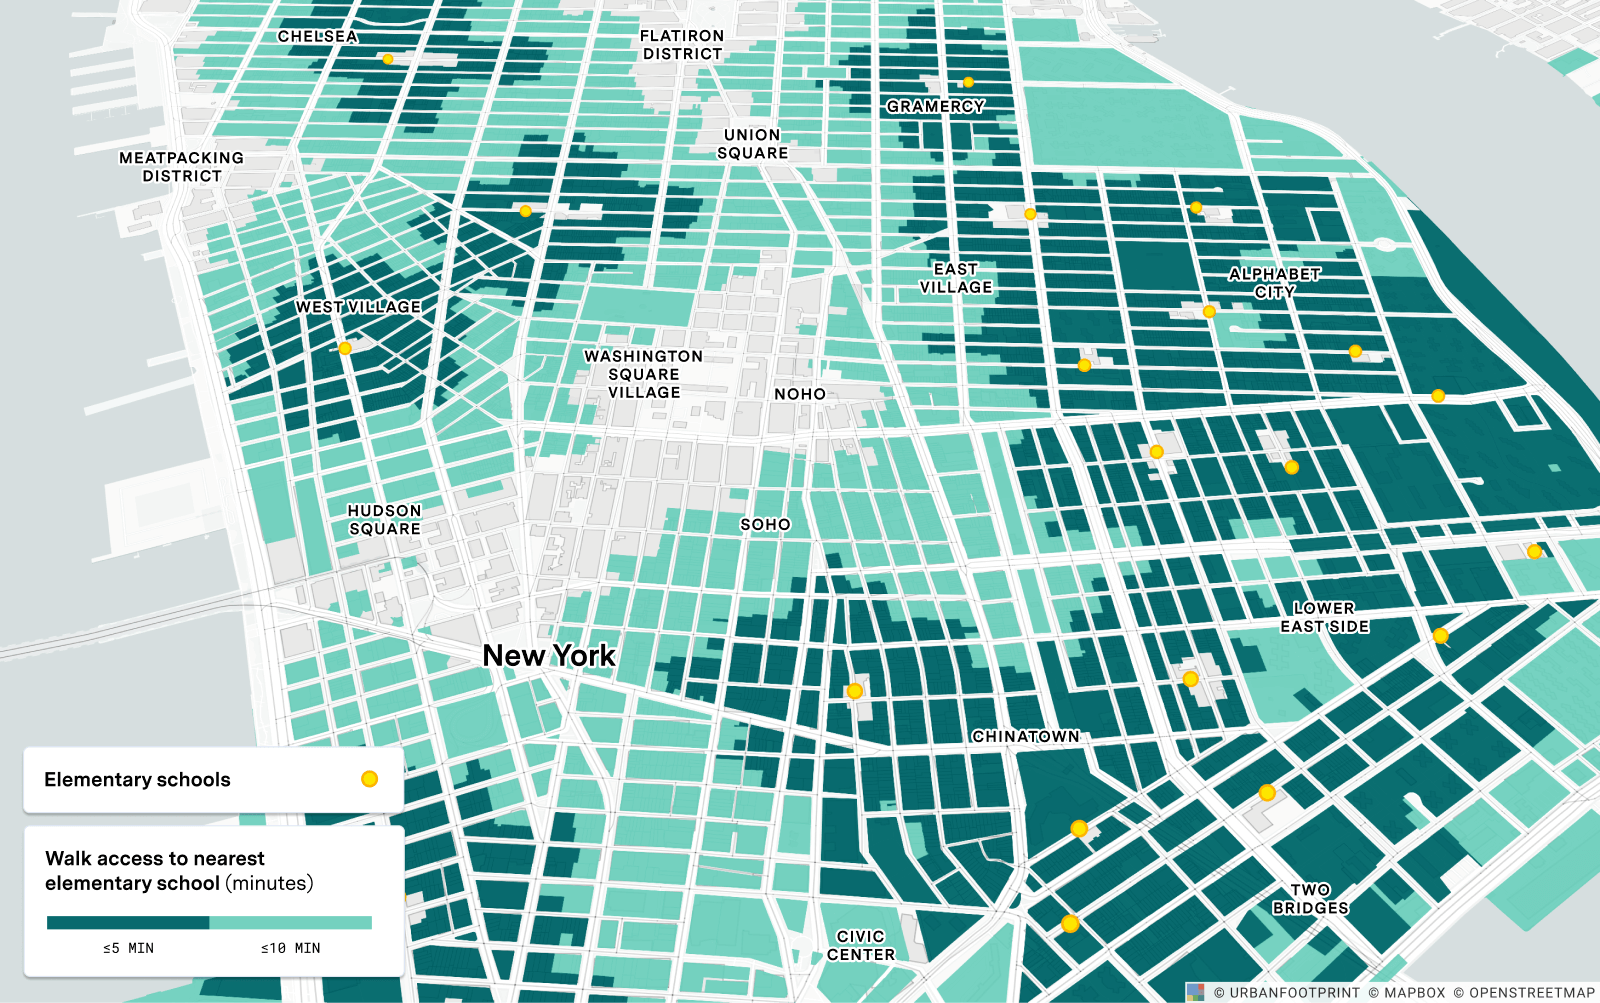
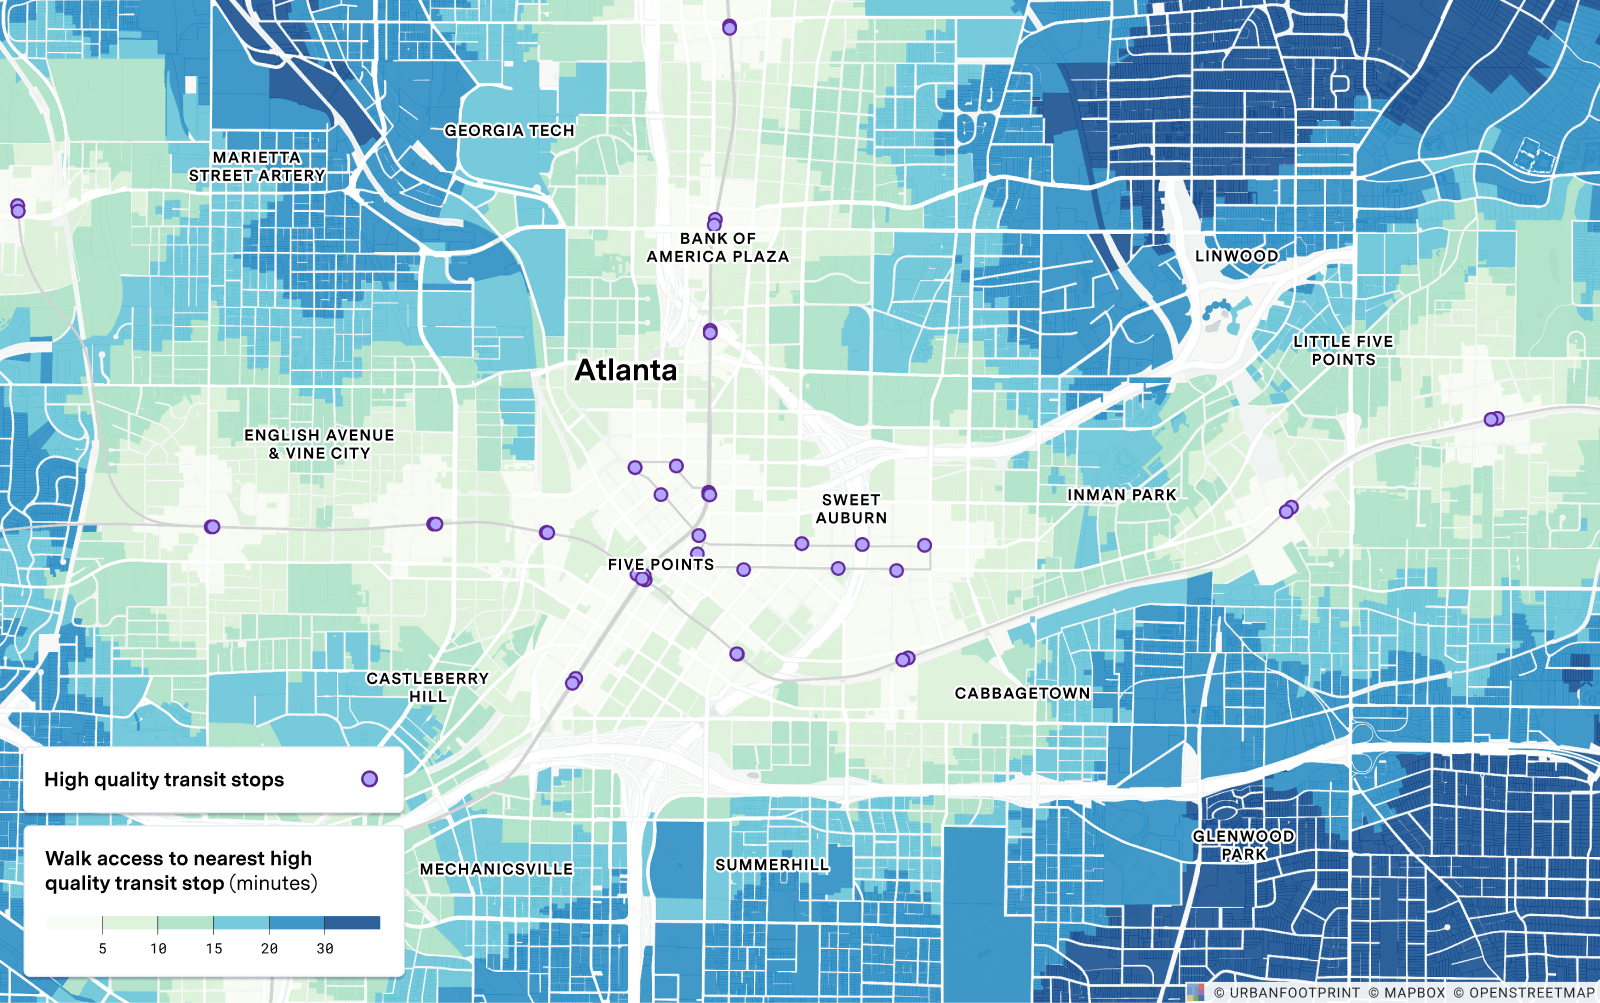
Once the data is in a workable format, we can begin to craft the story we want to display to our users. GeoJSON enables developers to use data-driven styling so that the information is closely tied to its corresponding geographic layers. To maintain visual consistency, there is an emphasis placed on colours, so it's clear how users should interpret the data. Effective design applies the perceptual dimensions of hue, saturation, and lightness, with three main types of colour schemes to form an interactive urban data visualization:
1. Sequential
Applied to ordered, numerical data.
Use cases: improvement ratios, price per square foot, distance to schools, transit, or amenities.
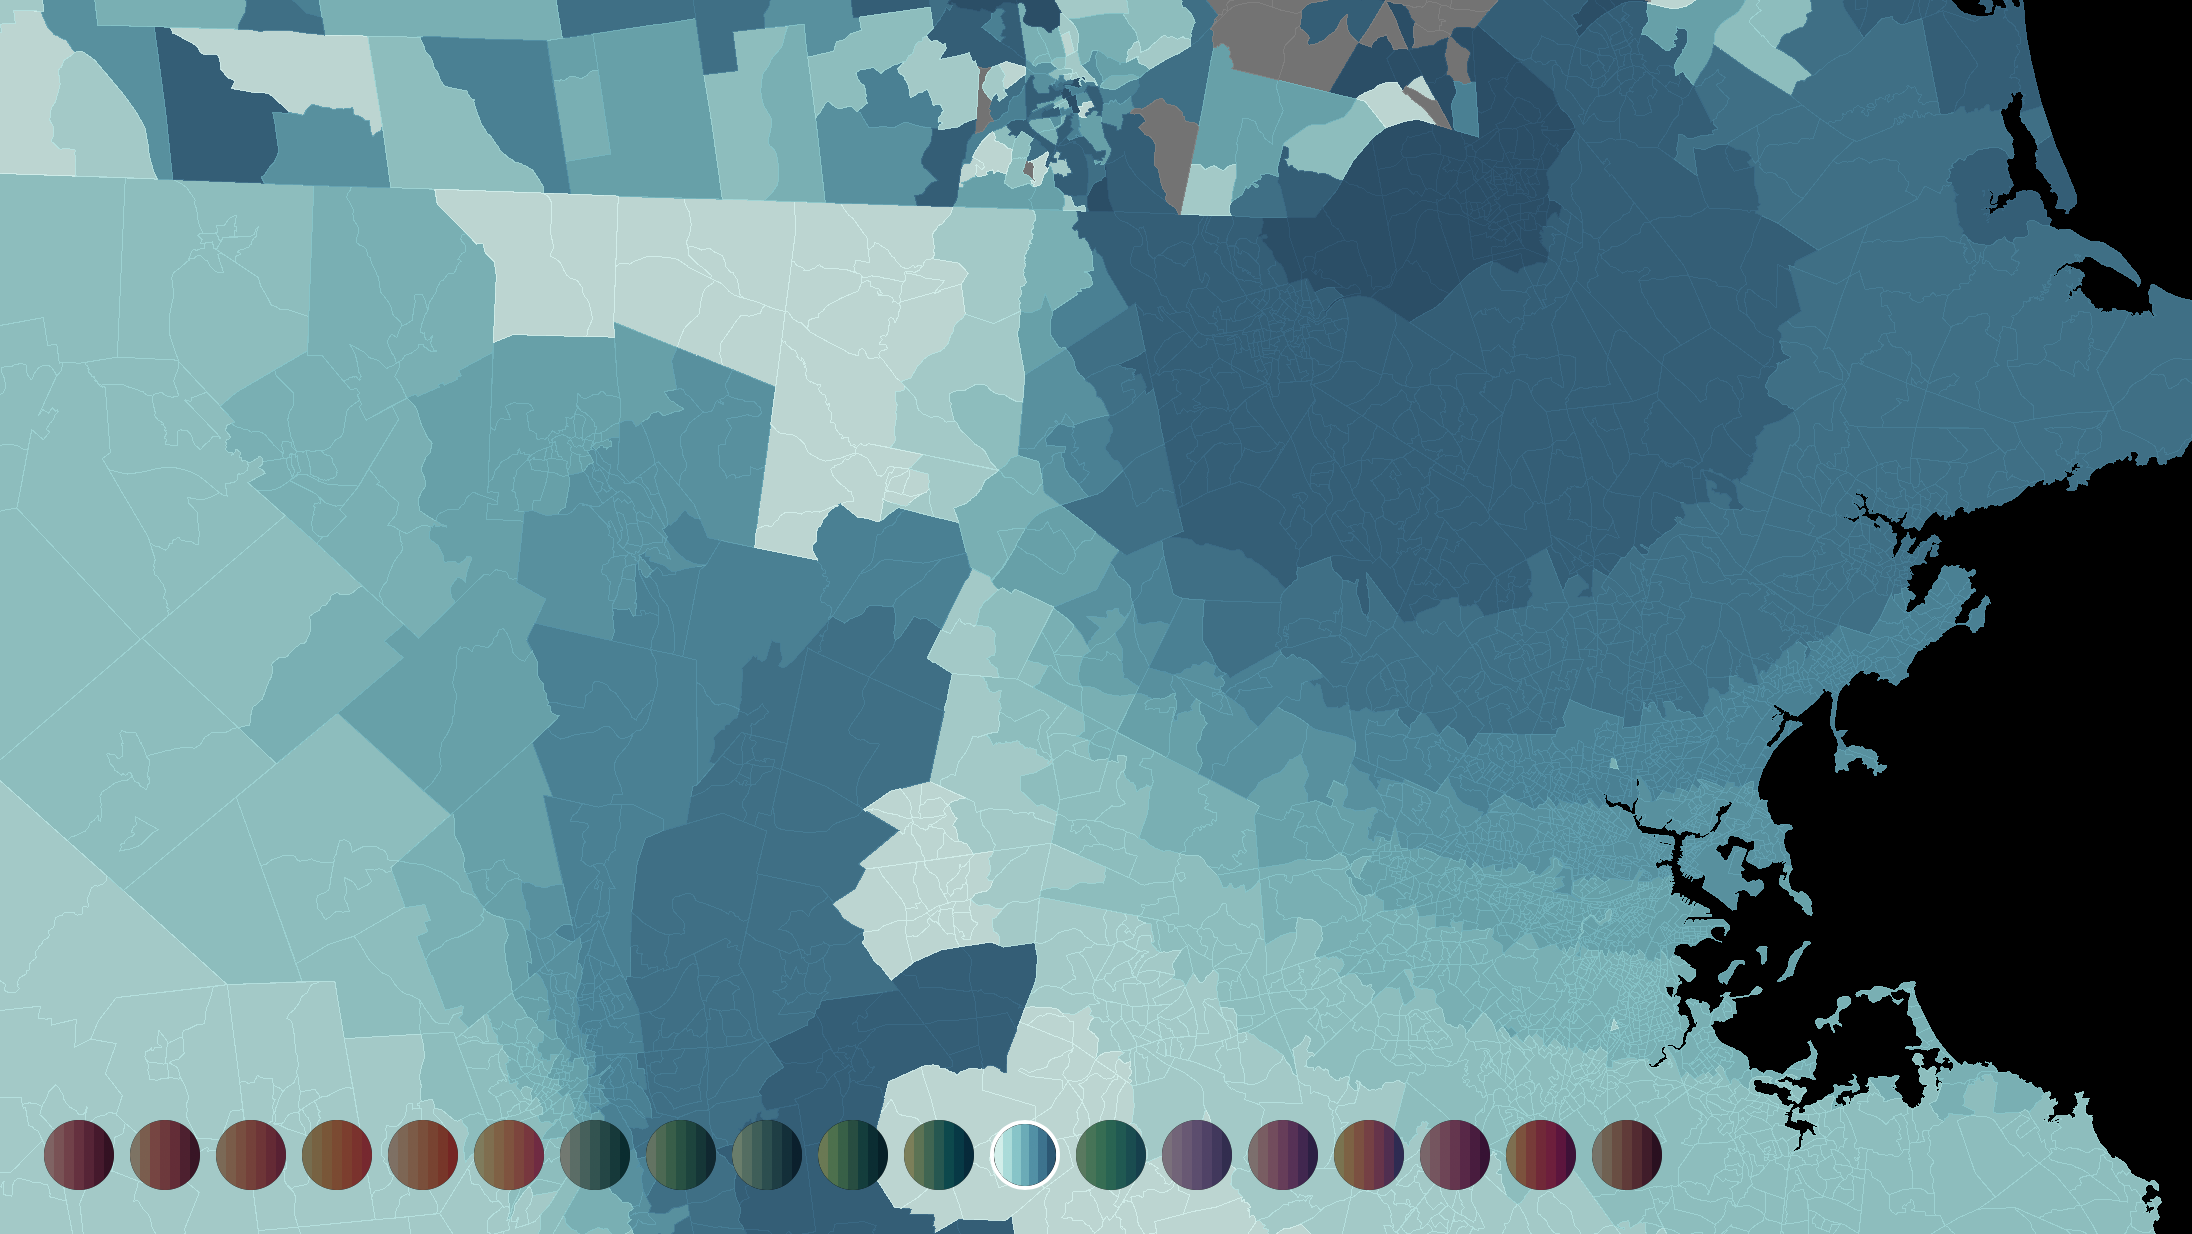
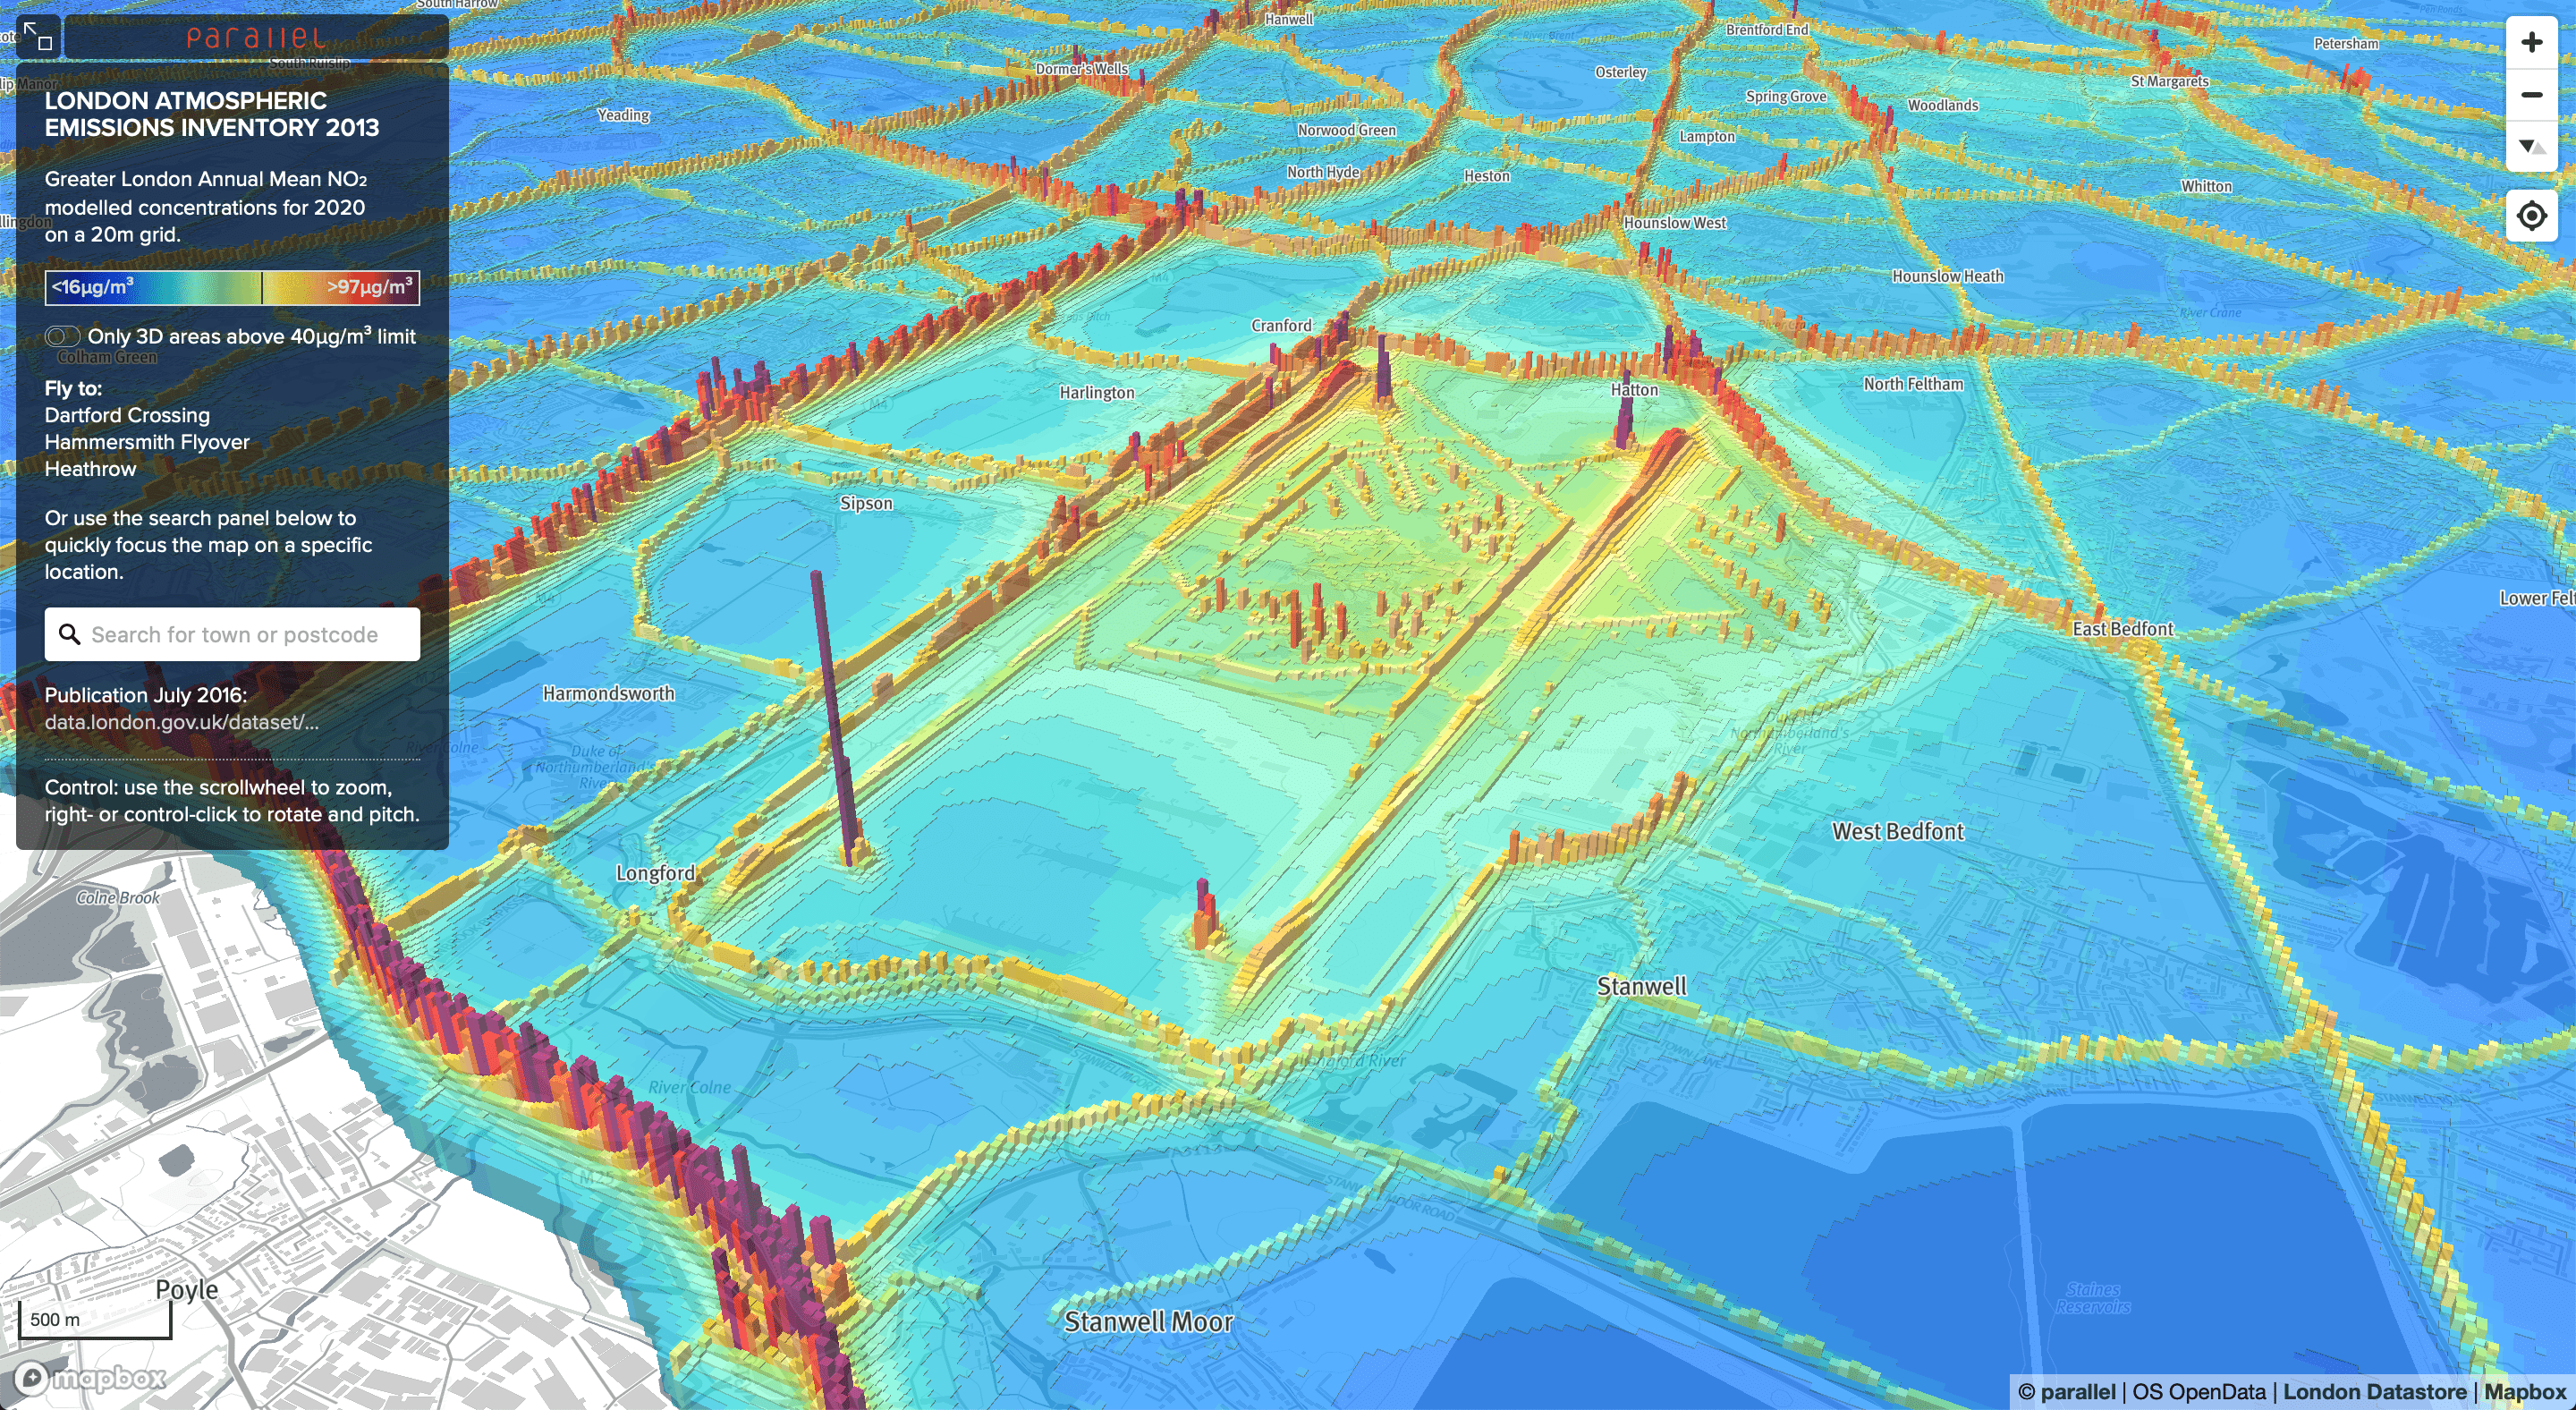
2. Divergent:
A combination of two sequential themes, with a breakpoint in the middle.
Use cases: traffic noise, flood plains, or emissions.
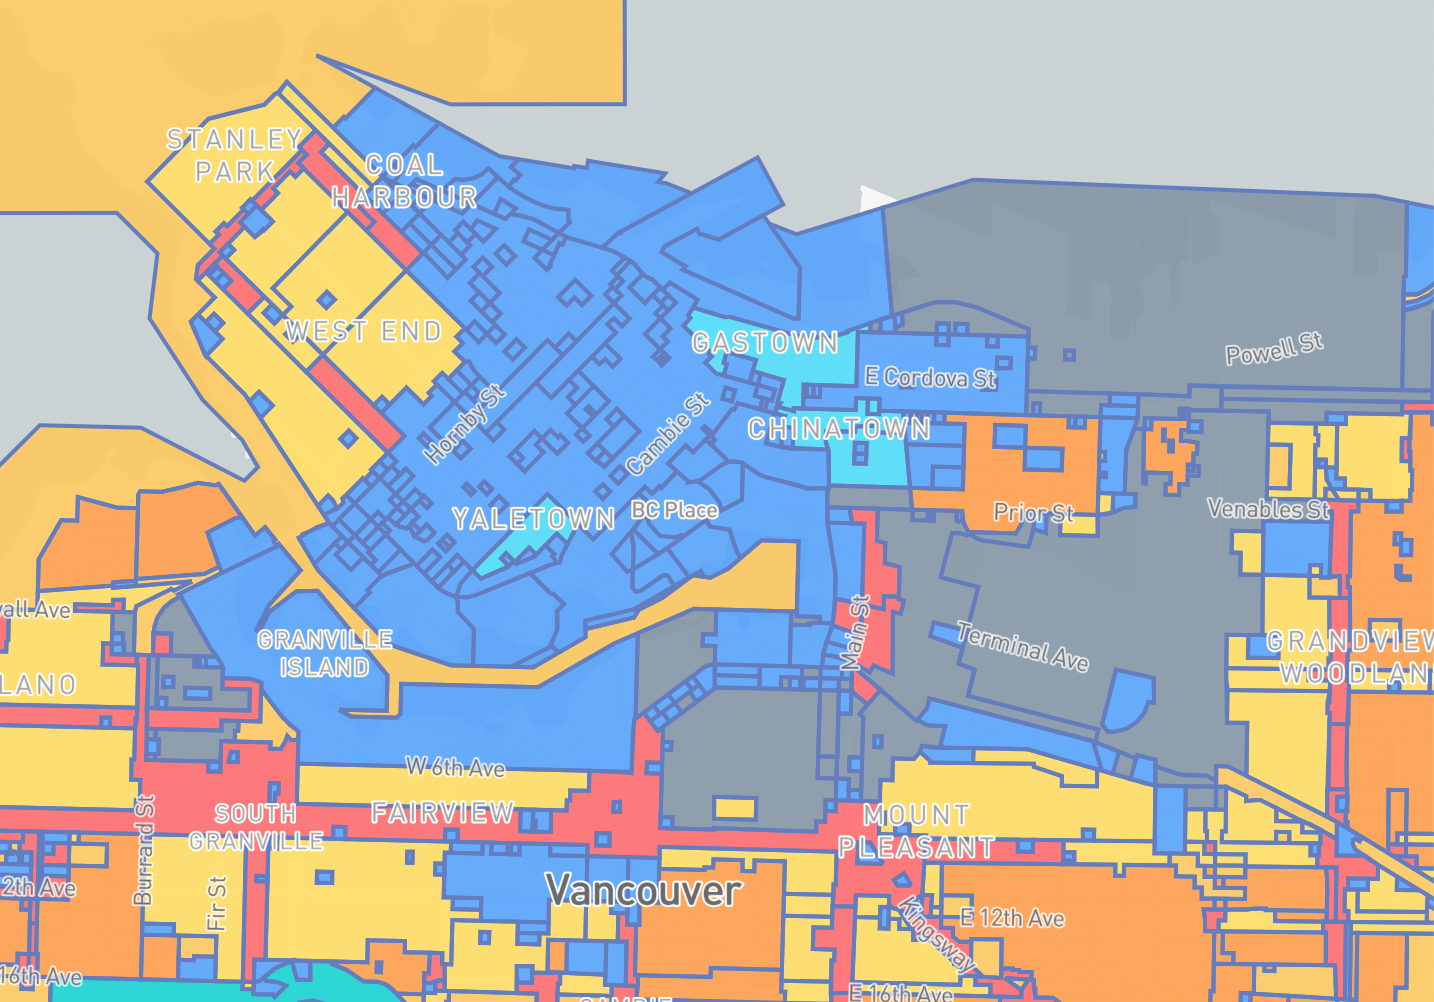
3. Qualitative
For discrete, unordered classes of nominal data.
Use cases: zoning, land-use categories, or ethnicities.
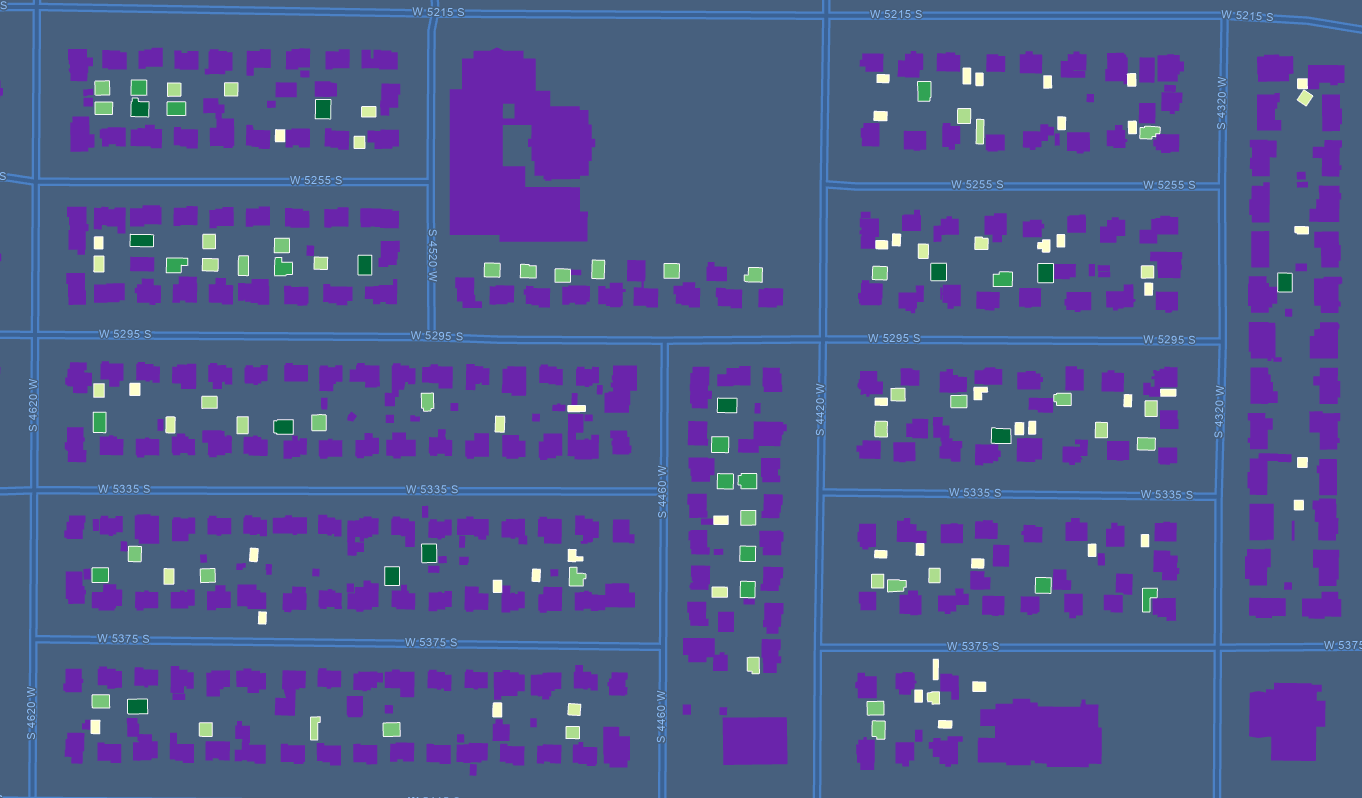
Insight into real property values
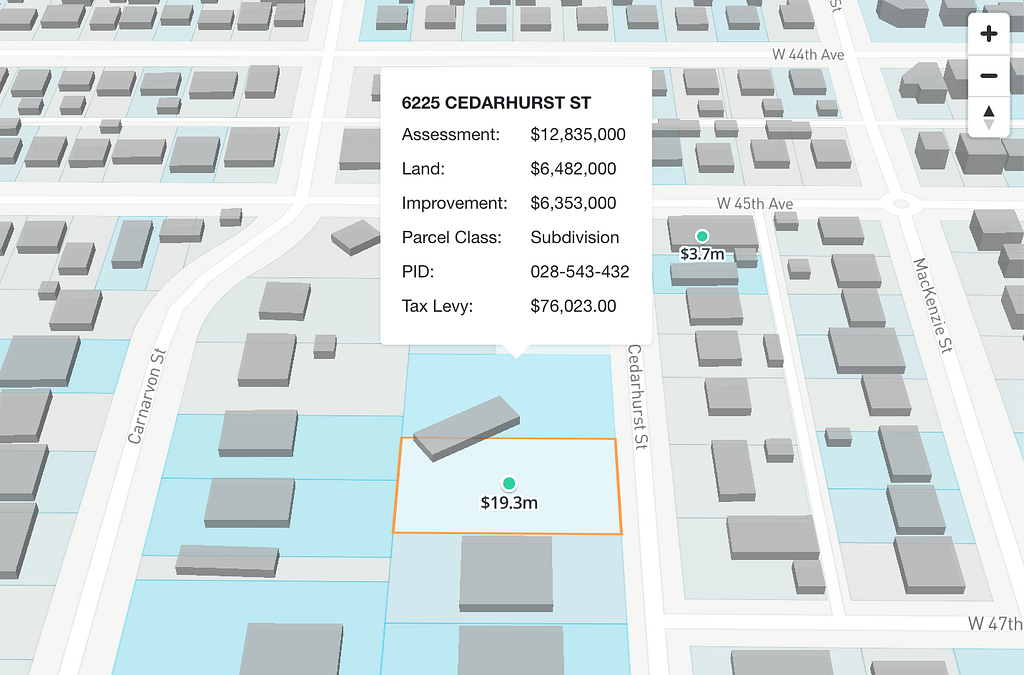
GIS helps us ask the right questions. For instance, if there are wide variations in land or improvement values for properties in the same neighbourhood, or perhaps on opposite sides of the street, how could we determine the highest and best use based on the principles of conformity, progression and regression?
Has the structure been upgraded?
Does the site suffer from negative external influences?
How does the orientation of the backyard appeal to the market?
What does the improvement ratio tell us about depreciation?
Can we see a property crossing a parcel boundary signifying a dominant and servient tenement?
Are there other properties along the same street that are inferior, and might see an increase in value once renovated?
GIS Parcels
Visualizations can provide substantial meaning to an investor, appraiser, lender, or homeowner by surfacing the facts quicker and more efficiently.
Re-thinking home
The pandemic has caused a great reshuffling and changed the way we think about where we live. Households are looking at different ways to upgrade their existing properties, thus lot eligibility becomes a greater consideration. Densification can come by way of an Accessory Dwelling Unit (ADU), or a Laneway House as flexible solutions. Provisioning allows households on single-family zoned lots the ability to build additional units, thus improving affordability and maximizing the use of space.
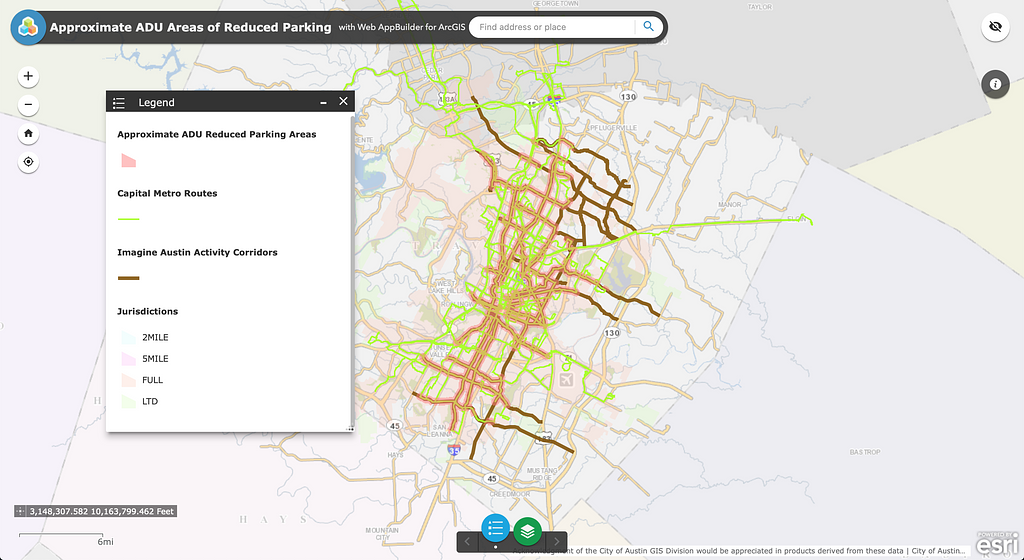
City of Austin ADU
Conversely, it can also limit a site's potential, as demonstrated in the City of Austin, where an amendment reduced the parking for a second unit to zero, if it is within a 1/4 mile from the edge of a right-of-way of an activity corridor also served by transit. This is shown as a "buffer" zone.
Standing out in a sea of sameness
As data is liberated, and technology democratized, it invariably leads to the masses attempting to capitalize on that trend. We all want more transparency, less friction, and greater return on our investment, whether it be time or capital. Most often you have to roll up your sleeves and create something yourself.
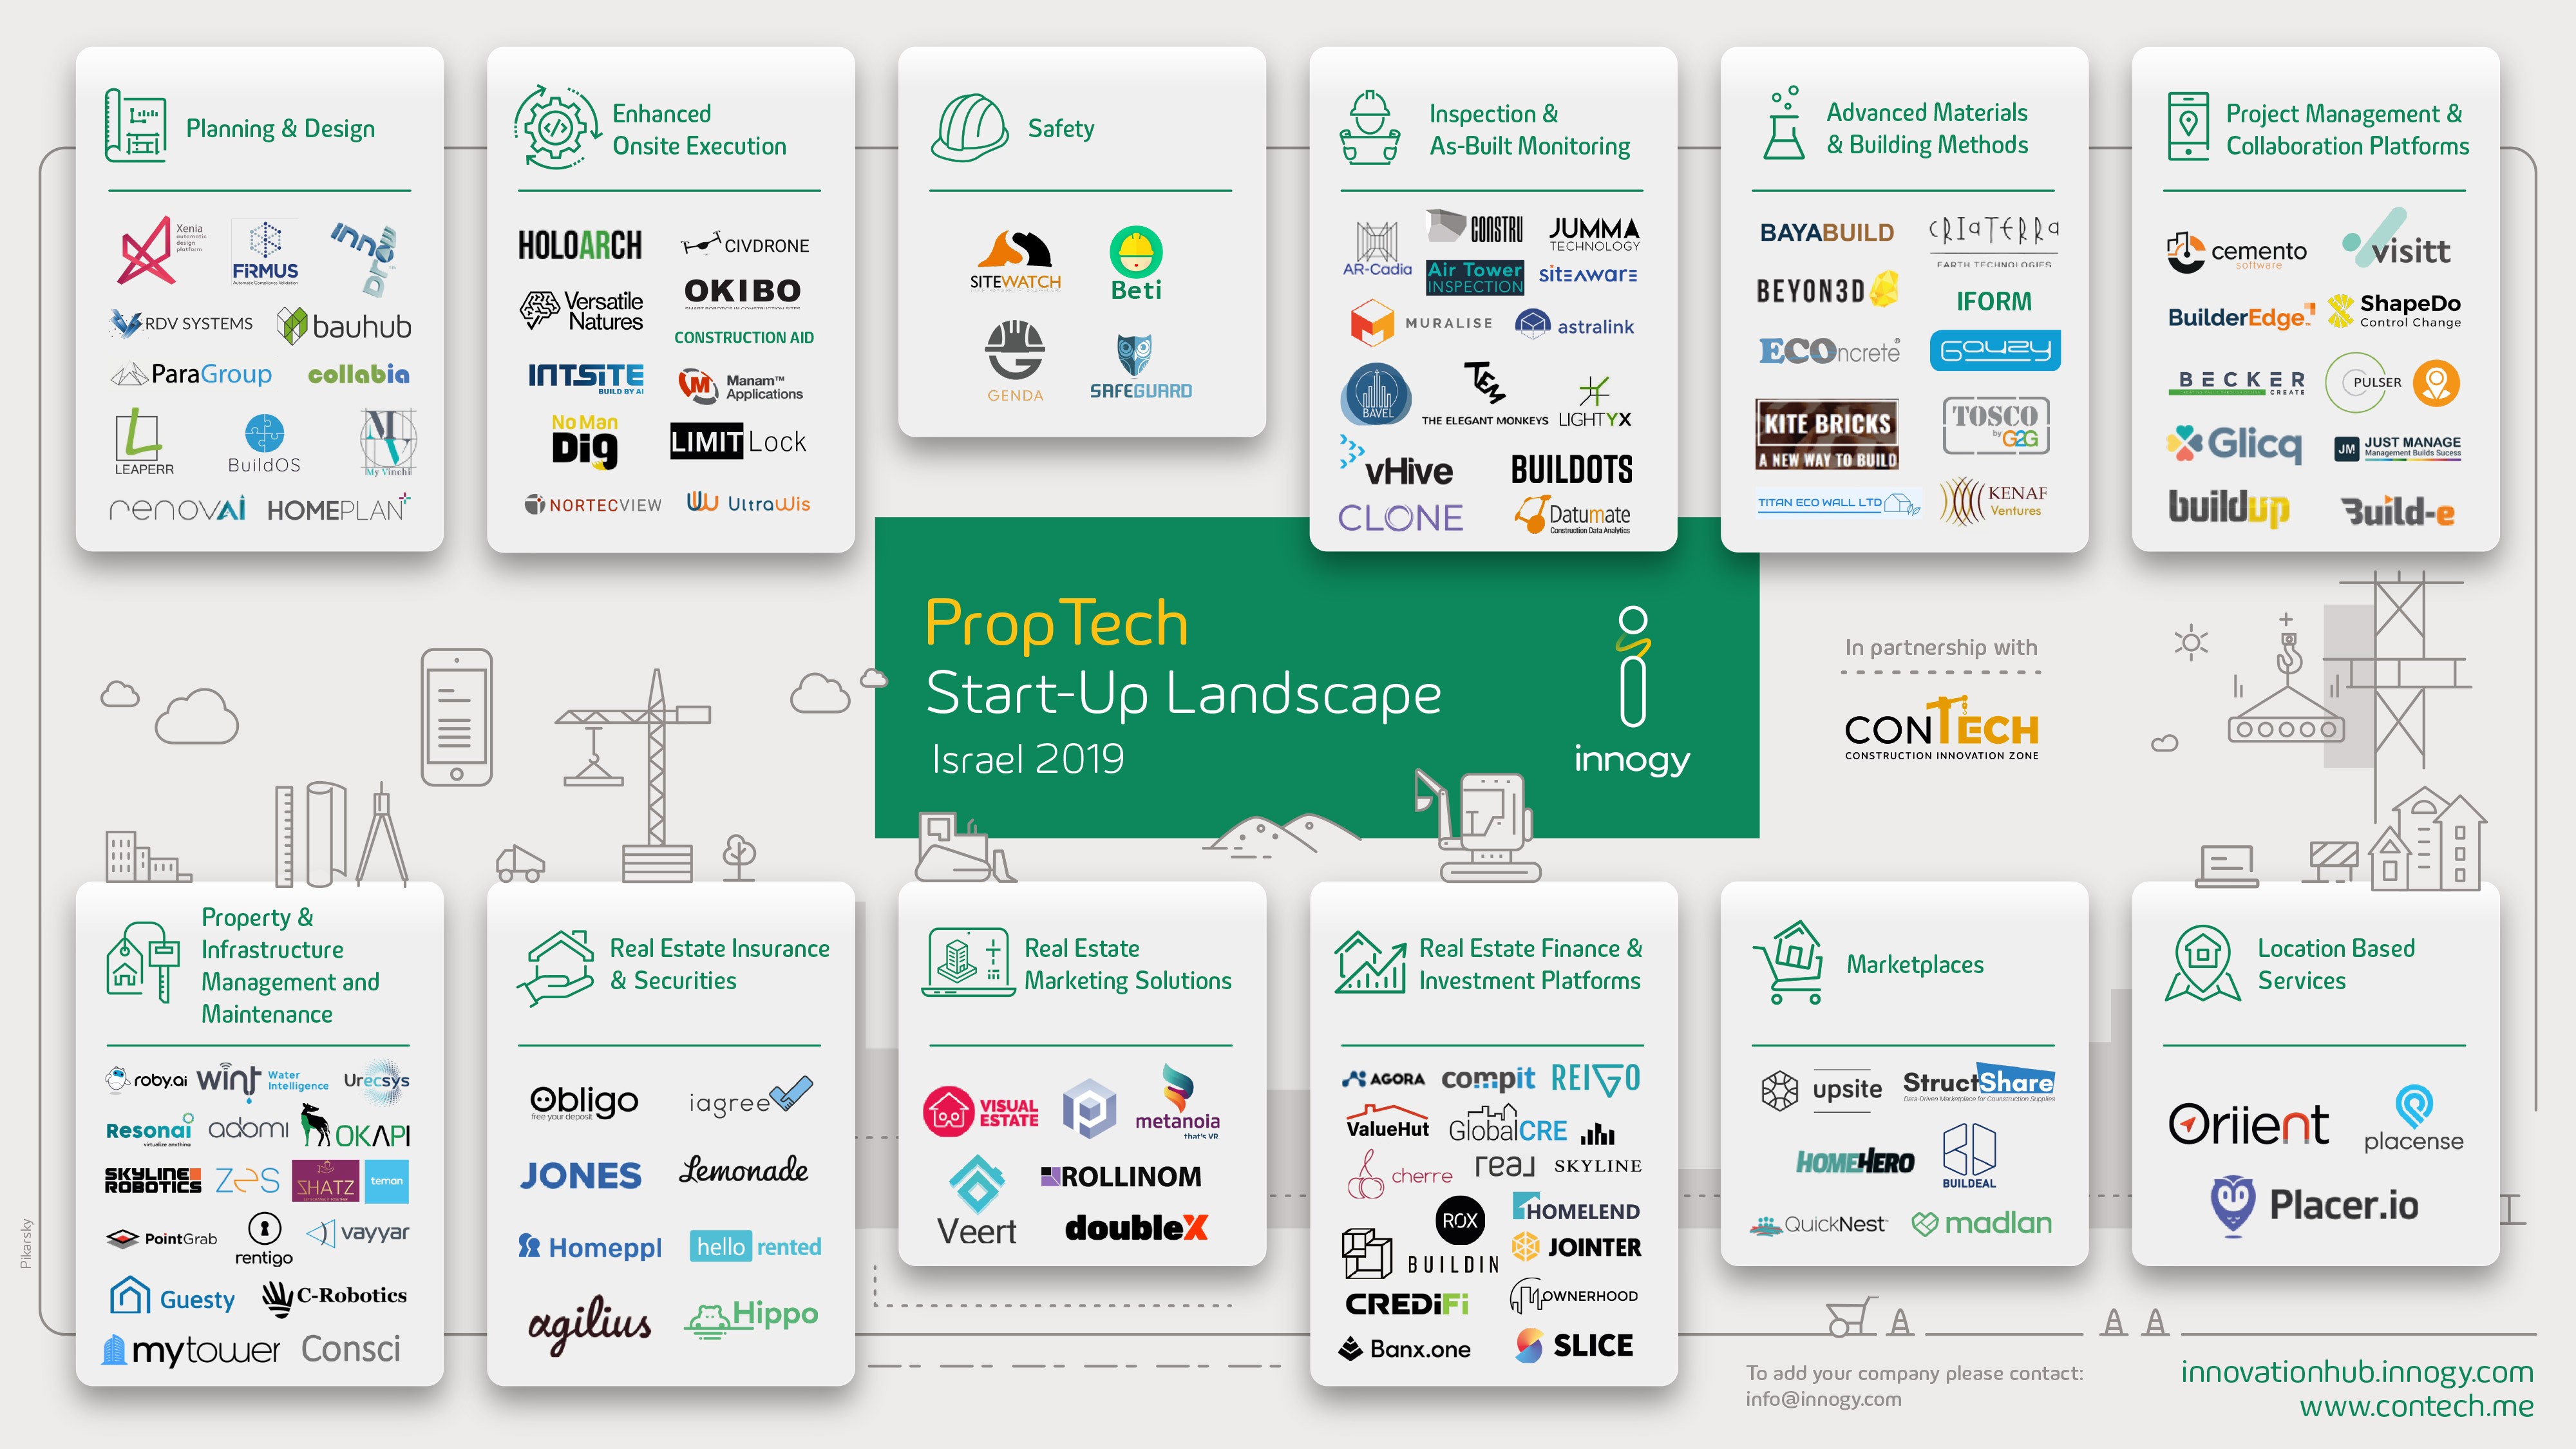
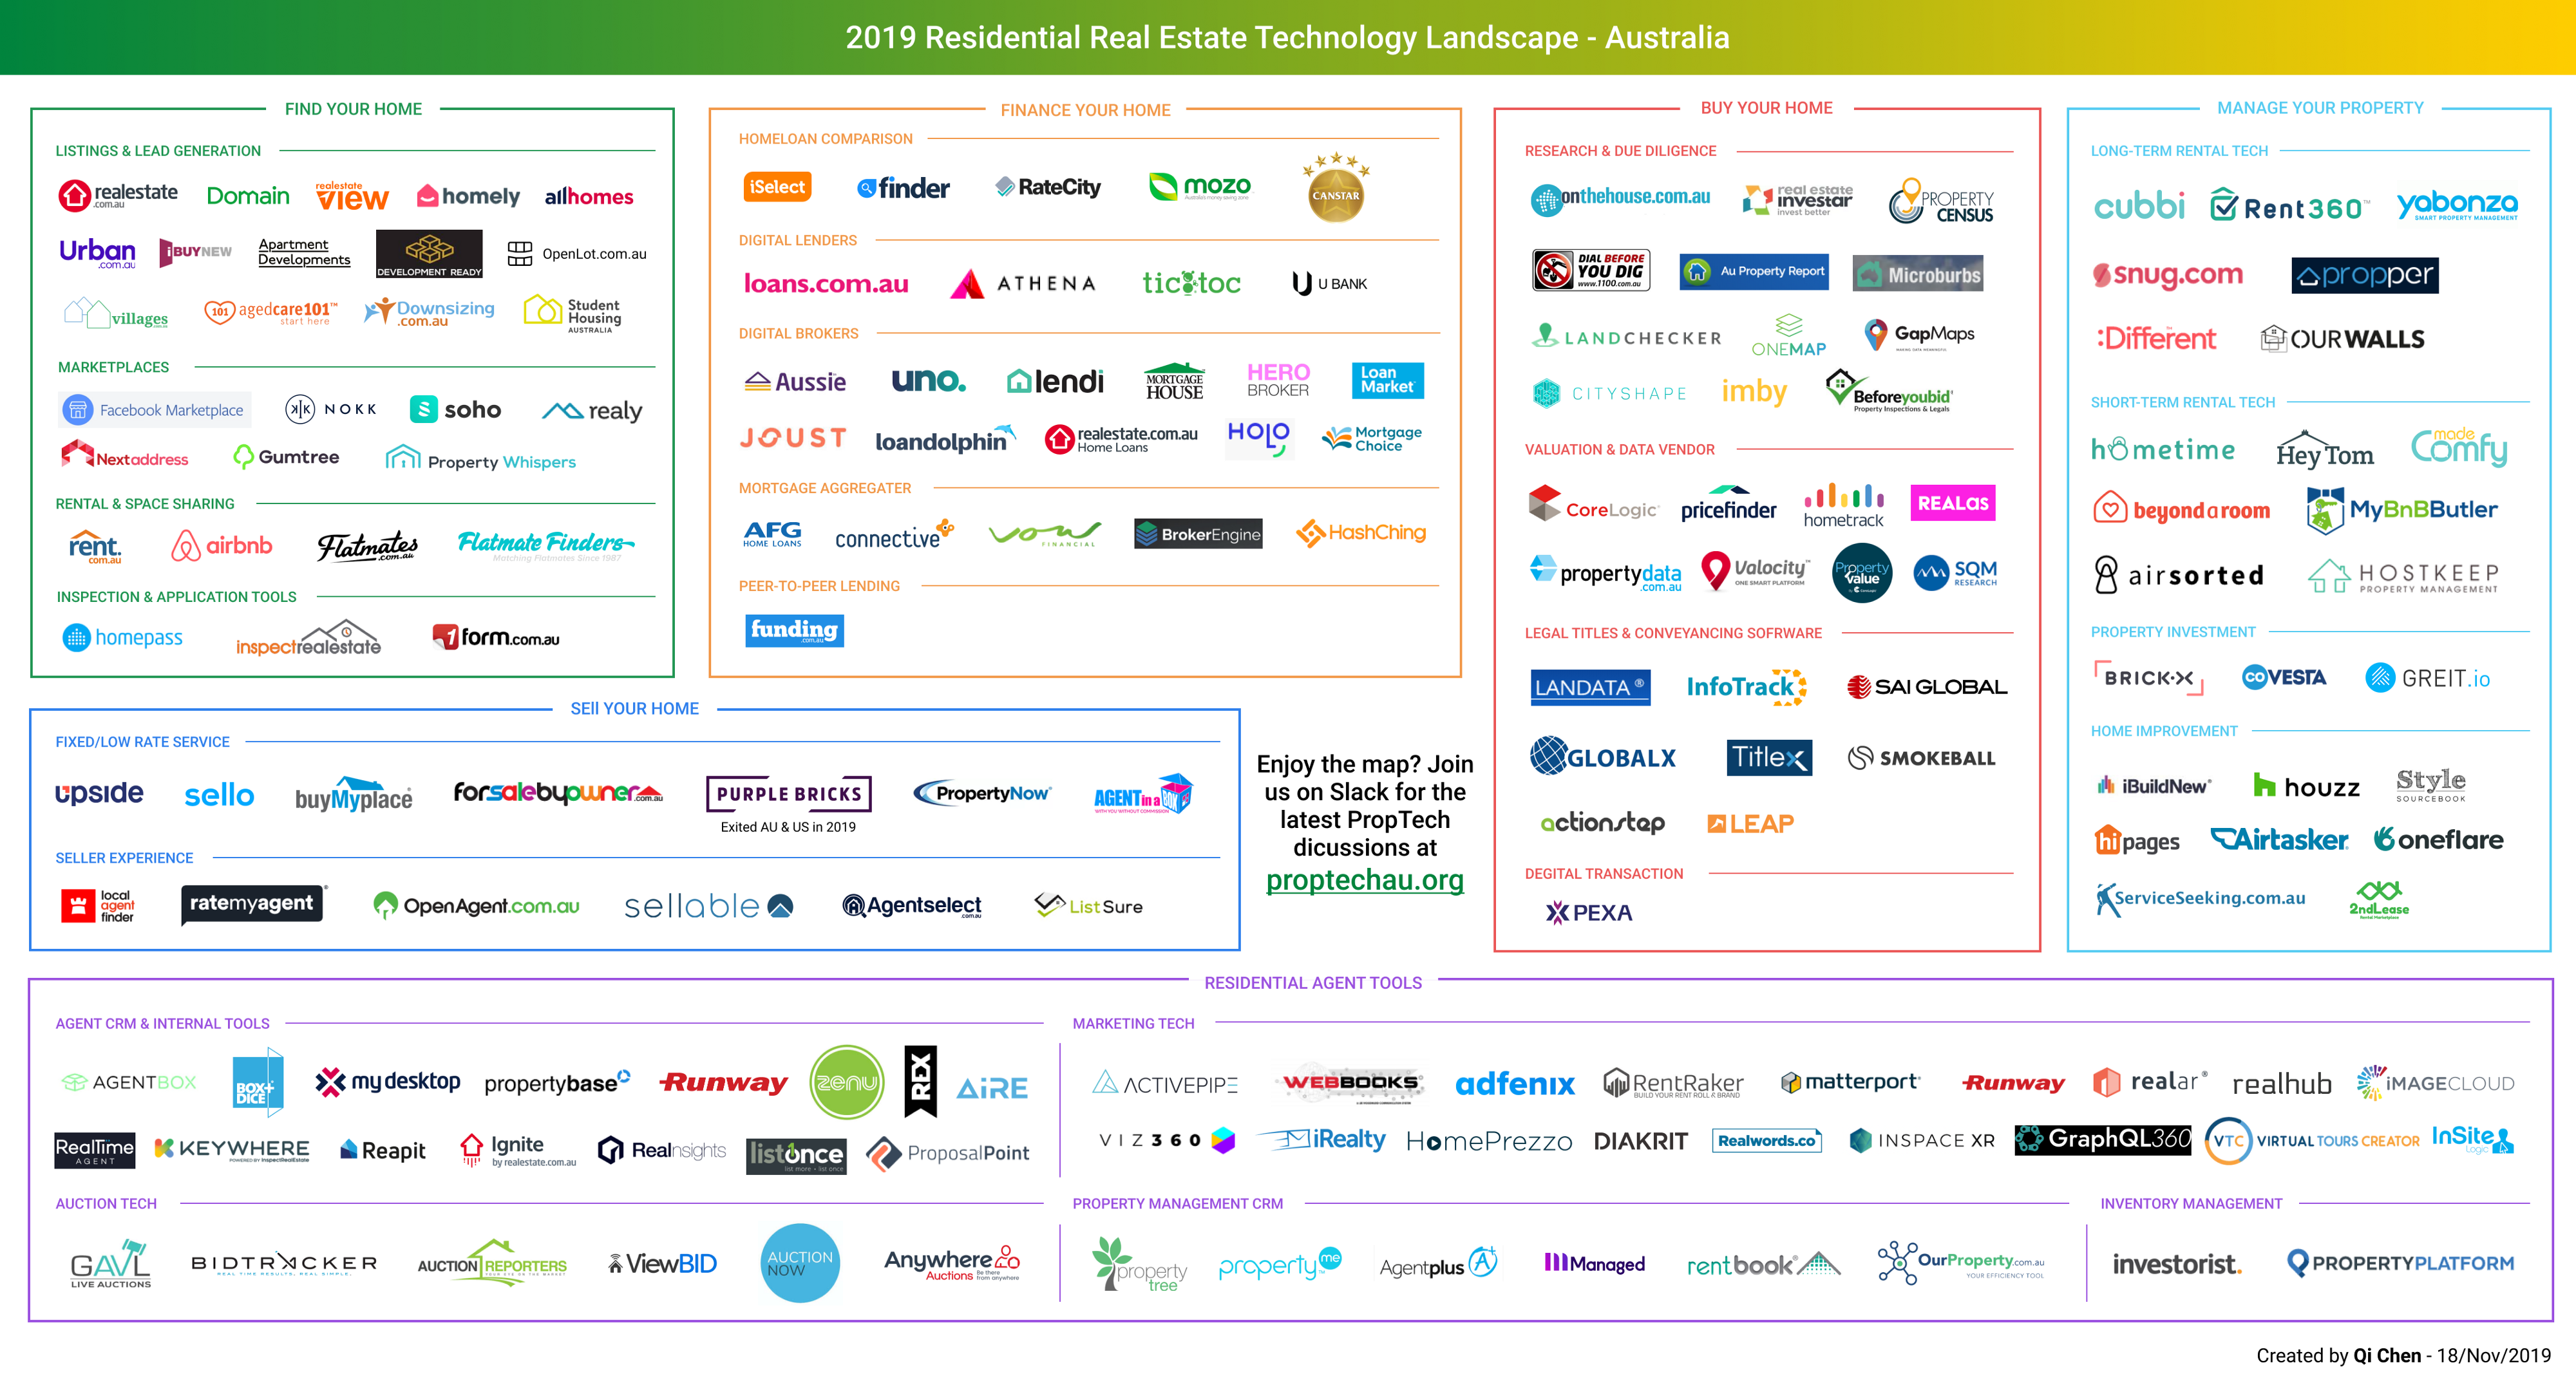
Technology like GIS is enabling a new generation of storytellers and providing a lens through which we can better interact with the world around us. While we are continuing to see more and more startups in the Proptech space—eventually the cream rises to the top—and in the end, it is authenticity that always delivers the most value.
“The tremendous price of competition is that you stop asking some bigger questions. Don't always go through the tiny little doors that everyone tries to rush through, maybe go around the corner, go through the vast gate no one is taking.” – Peter Thiel